Diagramming the Process: Recruitment and Selection Explained
Unleashing the Power of Visual Storytelling: Our Success Stories.

Apr 11, 2024
18 min read
%20(1).jpg)
Visualizing the Recruitment Funnel
Engaging the Eye for Insight: The Power of Recruitment Funnel Visualization
In the realm of talent acquisition, the recruitment funnel serves as a foundational framework, guiding HR professionals through the nuanced stages of attracting, engaging, and ultimately hiring the right candidates. By visualizing this process, organizations can gain a clearer understanding of their recruitment strategies, pinpointing areas of strength and opportunities for improvement. This approach to vision, not only streamlines the recruitment process but also enhances the presentation of recruitment methods, making it easier for stakeholders to grasp the journey a candidate undergoes from application to hire.
The concept of the recruitment funnel mirrors that of the sales funnel in marketing, adapted to the unique context of talent scouting. It begins with the broad task of attracting a large pool of candidates and narrows down through stages such as screening, interviewing, and offering, to secure the ideal employee. This visual representation can be effectively showcased through a PowerPoint presentation or a Google Slides deck, making complex processes accessible and engaging for all viewers.
To bring this concept to life, consider the innovative ways companies have utilized recruitment funnel diagrams. For instance, a tech giant may use an interactive slide presentation to detail its funnel, highlighting how they attract thousands of candidates through social media and job postings, yet maintain a rigorous screening process to ensure only the most qualified proceed. Such real-world examples not only illustrate the practical application of the recruitment funnel model, but also serve as a compelling recruitment PowerPoint or slide deck sample for others to emulate.
In supporting the efficacy of this approach, numerous studies and expert analyses underline the value of visualization in recruitment. For example, a report by LinkedIn on recruitment trends highlights that companies with clearly visualized recruitment processes see a 50% reduction in time-to-hire and a significant improvement in candidate satisfaction rates. These statistics, often found in HR presentations on recruitment or industry whitepapers, reinforce the importance of adopting visual aids like funnel diagrams to enhance the recruitment and selection process.
Flowcharts for Recruitment Processes
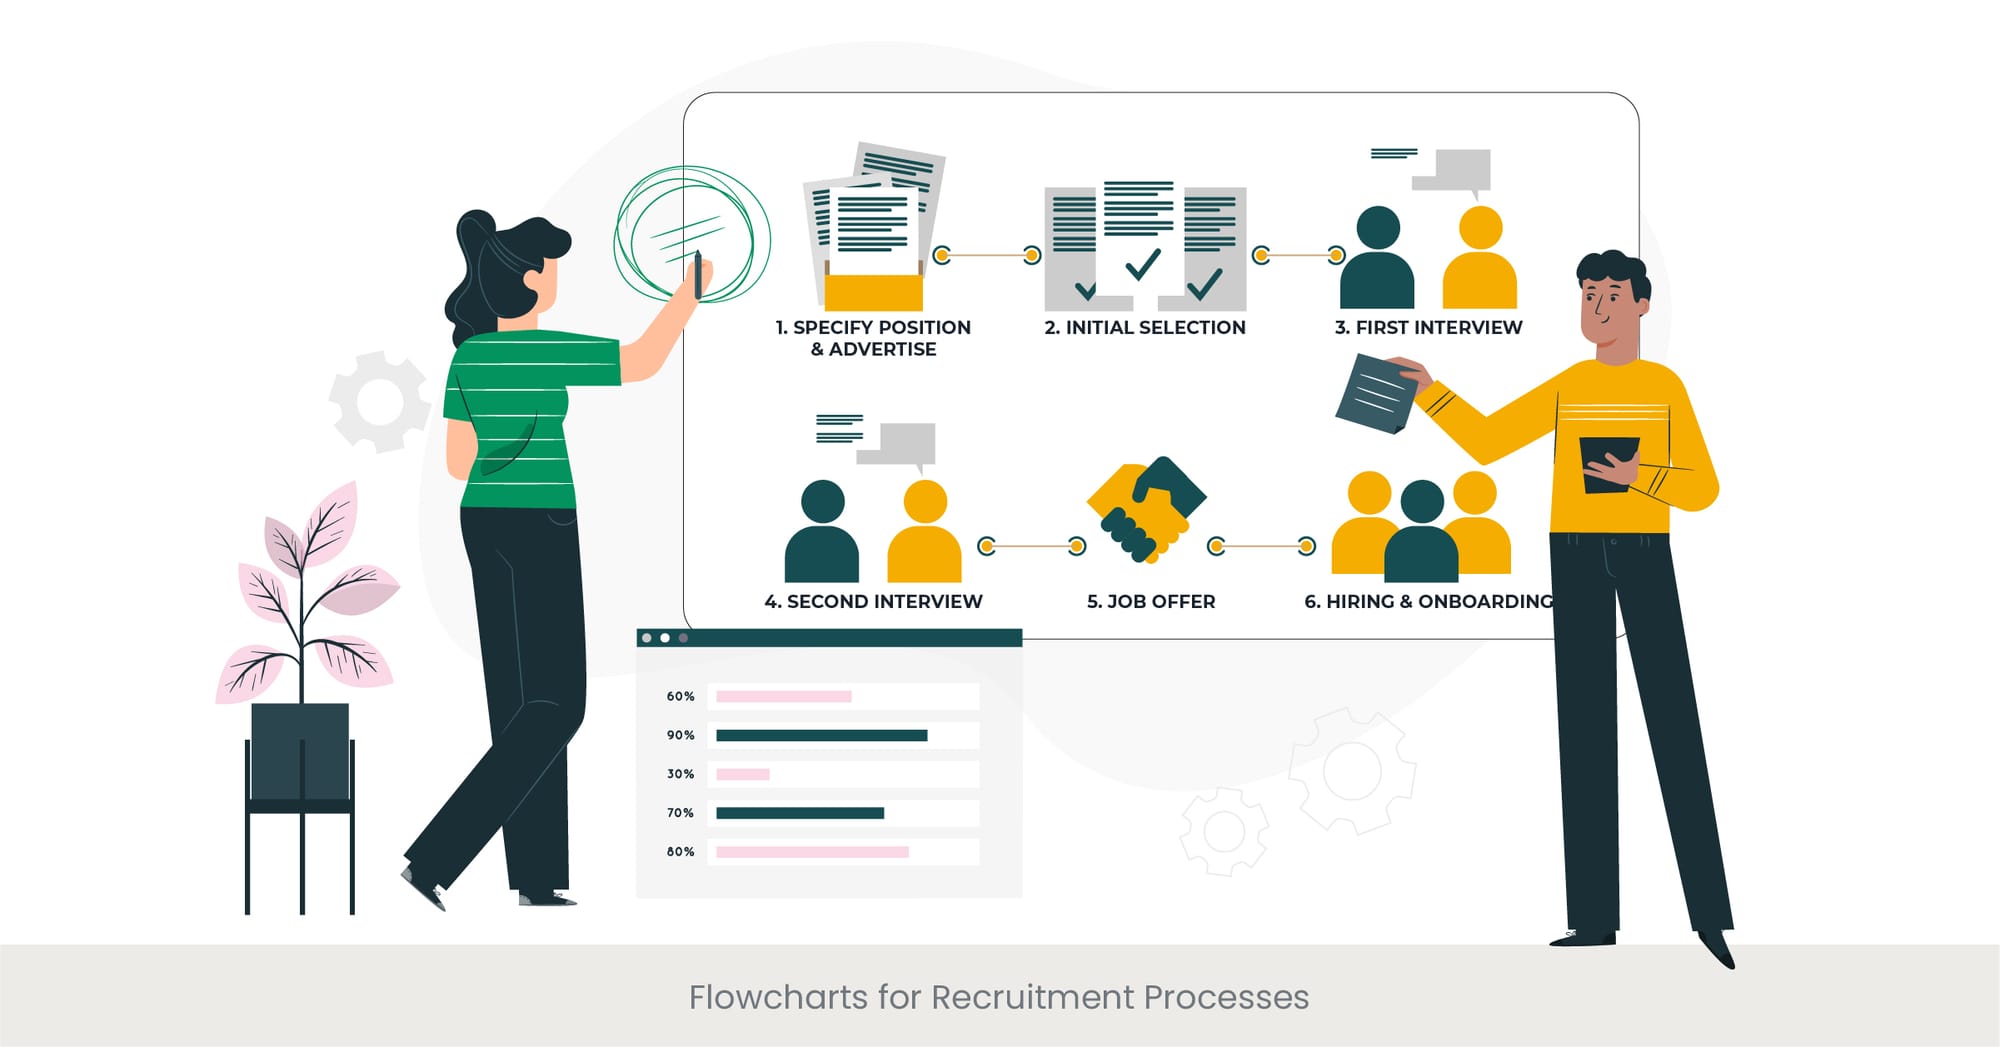
Streamlining Success: The Strategic Use of Recruitment Process Flowcharts
In the intricate dance of recruitment and selection, clarity and efficiency are paramount. Flowcharts emerge as invaluable tools in this context, offering a visual step-by-step guide to the recruitment process. These diagrams not only simplify complex procedures but also serve as a vital communication tool, ensuring that all team members, from HR to department heads, are aligned on the recruitment strategy. Incorporating flowcharts into a PowerPoint presentation or HR presentation on recruitment allows for a dynamic and engaging way to share the recruitment process with a broader audience, ensuring everyone is on the same page.
Historically, the use of flowcharts in business processes dates back to the early 20th century, serving as a method to document sequential tasks in manufacturing and administration. In recruitment, the application of flowcharts provides a visual narrative of the journey from identifying a vacancy to filling the position, encompassing stages such as job description formulation, candidate sourcing, screening, interviewing, and onboarding. By outlining each step, recruitment teams can identify redundancies, streamline operations, save on, and enhance the overall efficiency of the talent acquisition process.
Companies across various industries have adopted recruitment process flowcharts to great effect. For instance, a retail giant might use a detailed flowchart in their recruiting PowerPoint to showcase the steps involved in hiring store managers, from the initial talent acquisition phase to final selection. Such examples not only demonstrate the utility of flowcharts in organizing recruitment efforts but also inspire others to adopt similar practices in their presentations on recruitment methods.
Research and case studies underscore the effectiveness of using flowcharts in recruitment. A study published in the "Journal of Business and Psychology" found that organizations employing visual tools like flowcharts in their recruitment processes experienced a 40% decrease in time-to-hire and a significant improvement in candidate quality. This empirical evidence, often highlighted in professional HR presentations and PowerPoint templates on recruitment, solidifies the role of flowcharts as essential instruments in the optimization of recruitment strategies.
Ready to simplify your recruitment strategies with effective visuals? Check out INK PPT’s comprehensive case studies to see how we’ve helped businesses enhance their recruitment presentations. Explore Our Case Studies.
Diagrams for Role-Specific Recruitment Strategies

Tailoring the Hunt: Custom Diagrams for Each Role
The recruitment landscape is vast and varied, with each role presenting its own set of challenges and requirements. Diagrams for role-specific training and recruitment strategies become essential tools, allowing HR professionals to tailor their approach to the unique needs of each position. By employing customized diagrams in recruitment presentations or strategy documents, recruiters can clearly outline the specific stages, criteria, and evaluation methods pertinent to different roles, from technical positions requiring specific expertise to leadership roles demanding a unique set of soft skills.
The genesis of role-specific recruitment strategies can be traced back to the acknowledgment that one size does not fit all in talent acquisition. Historical practices in HR emphasized standardized recruitment processes, which, while efficient, often failed to address the nuanced needs of specialized roles. Today, diagrams and flowcharts enable recruiters to visually differentiate the recruitment process for a software engineer versus a sales executive, for instance, highlighting the distinct paths and evaluation stages each candidate undergoes. Such visuals can be effectively incorporated into a PowerPoint template or Google Slides deck for a presentation on recruitment methods, enhancing understanding and engagement among hiring teams and stakeholders.
Examples of successful role-specific recruitment strategy diagrams abound in sectors like technology and healthcare, where the disparity in role requirements is particularly pronounced. A tech company, for instance, might utilize a series of diagrams in place of a recruiting PowerPoint presentation to delineate the recruitment funnels for engineers, designers, and product managers, each with its own set of screenings, technical challenges, and interview panels. These practical applications not only demonstrate the versatility and utility of custom diagrams but also serve as a valuable reference for others looking to optimize their recruitment presentations.
Supporting the adoption of these practices, research from the Society for Human Resource Management (SHRM) highlights that companies implementing role-specific recruitment strategies, aided by clear visual diagrams, report higher satisfaction rates among hiring managers and find a better fit between candidates and roles. Such findings, often shared in HR presentations or white papers on recruitment, underscore the importance of customizing recruitment approaches and the powerful role that visual aids like diagrams play in enhancing the recruitment and selection process.
Enhancing Understanding Through Simplified Visuals
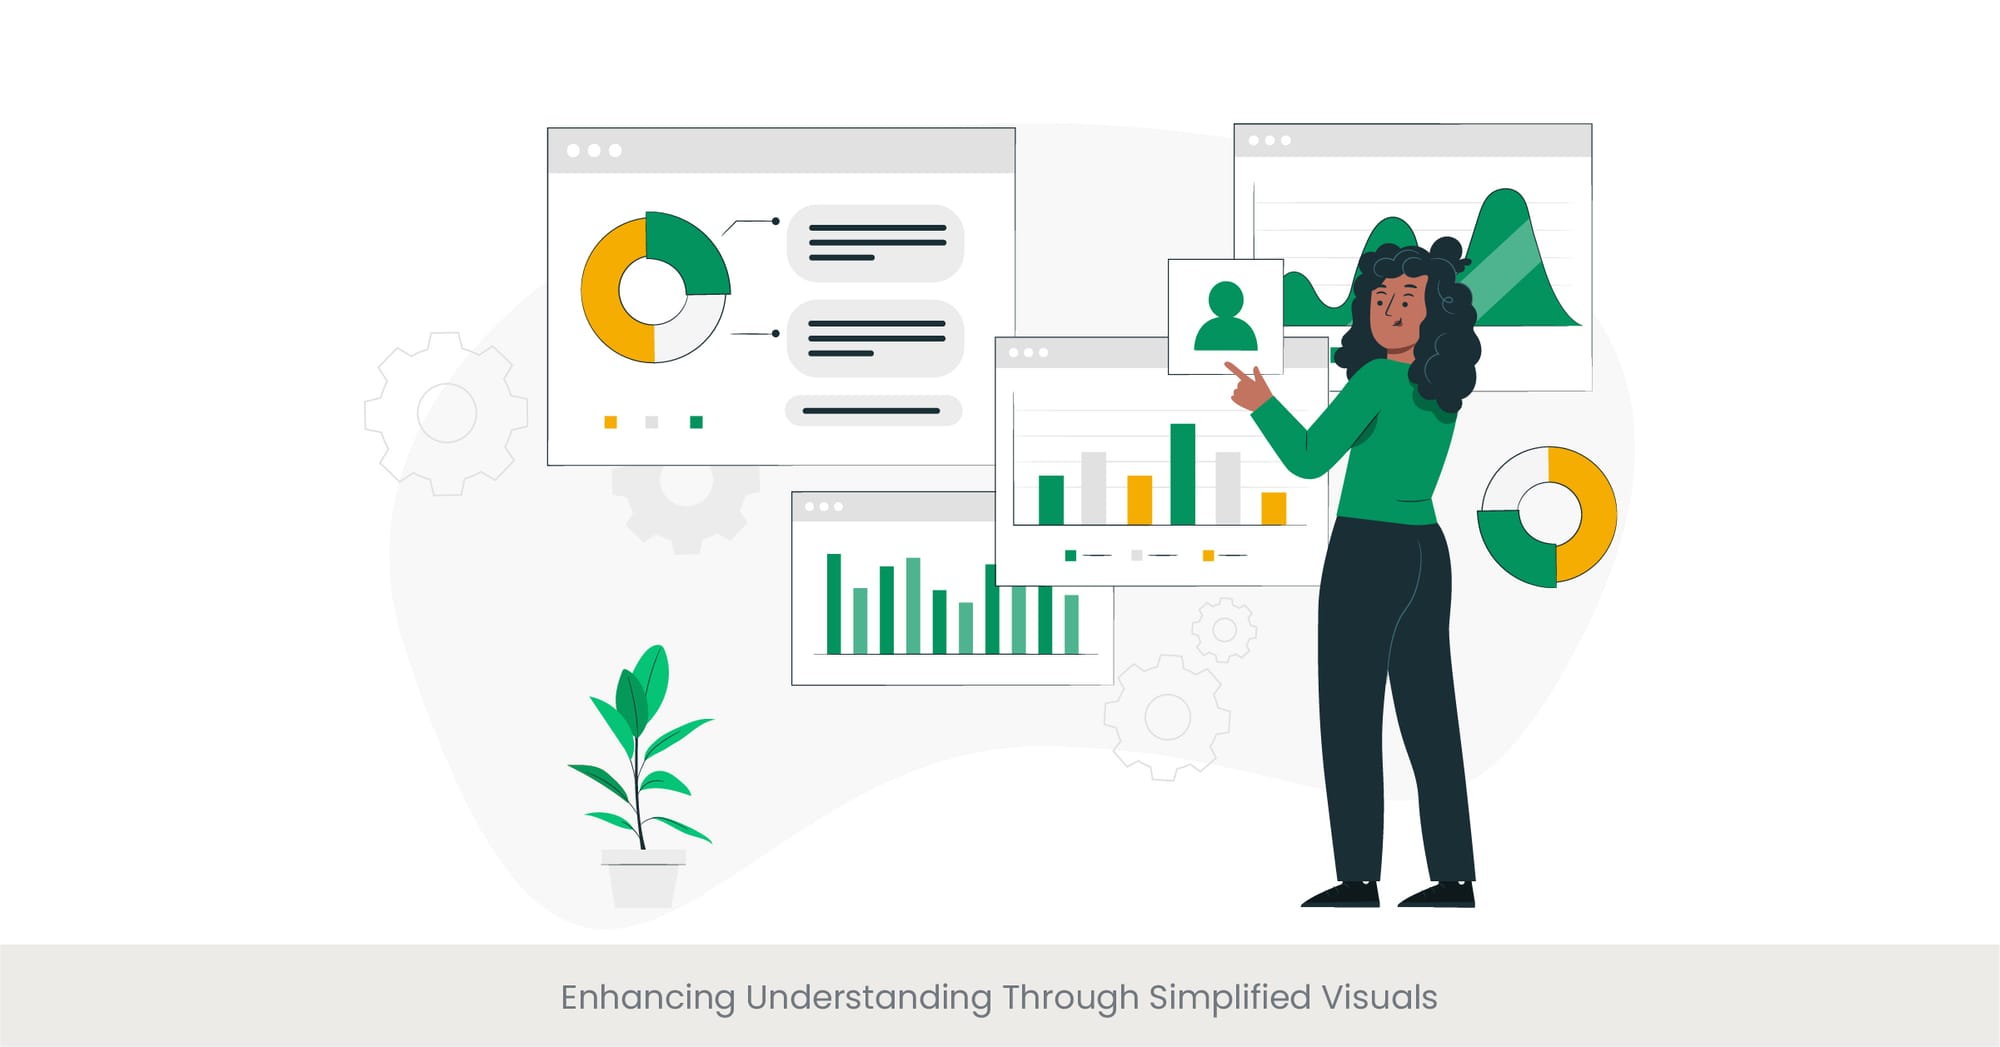
Clarity Through Simplicity: The Impact of Simplified Visuals in Recruitment
In today’s fast-paced recruitment environment, the ability to convey complex information quickly and clearly is invaluable. Simplified visuals serve as a bridge, translating intricate recruitment processes into understandable and engaging formats. Whether it’s through a streamlined PowerPoint presentation or an intuitive Google Slides deck, the power of simplified visuals lies in their ability to break down the recruitment and selection process into digestible parts, making it accessible to all stakeholders involved. This approach not only facilitates a deeper understanding of the process but also promotes a more collaborative and efficient recruitment strategy.
The evolution of simplified visuals in recruitment mirrors broader trends in information design, where the emphasis has shifted towards minimalism and clarity. This trend acknowledges the cognitive load on individuals bombarded with information and seeks to offer a solution through visuals that are easy to understand and remember. In the context of recruitment, this means creating diagrams, flowcharts, and slides that highlight key stages in the recruitment process, essential criteria, and timelines without overwhelming the viewer. Such visuals are especially effective in HR presentations on recruitment, where conveying the essence of the strategy concisely is critical.
The application of simplified visuals in recruitment can be seen across various industries and companies. For example, a multinational corporation might use a series of clean, concise diagrams in their recruitment PowerPoint to outline the path from candidate sourcing to onboarding, making it easy for team members across the globe to grasp the process quickly. These examples not only illustrate the utility of simplified visuals in enhancing comprehension but also serve as a template for how to construct an effective recruiting PowerPoint or presentation on recruitment methods.
The efficacy of simplified visuals in recruitment is backed by research indicating that visual aids can significantly improve comprehension and retention of information. According to a study by the Visual Teaching Alliance, visuals are processed 60,000 times faster than text, and 65% of people are visual learners. This underscores the importance of incorporating simplified visuals into presentations on recruitment strategies, ensuring that the message is not only received but also understood and remembered. Such statistics, often cited in industry presentations and academic papers, validate the strategic use of visuals in recruitment to enhance understanding and engagement.
Transform complex hiring processes into clear, actionable insights with custom diagrams from INK PPT. Dive into our expert guides for more tips on how to streamline your HR presentations. Get Started with Our Guides.
Tools for Creating Effective Process Diagrams

Crafting Precision: Tools That Elevate Recruitment Visualization
The creation of effective process diagrams for recruitment strategies hinges on the selection of the right tools. In an age where the visual presentation of information can significantly impact understanding and engagement, choosing software and applications that allow for the creation of clear, impactful visuals is crucial. From sophisticated PowerPoint presentations to dynamic Google Slides decks, the tools at our disposal enable recruiters to craft diagrams that not only convey the recruitment process with precision but also engage and inform their audience effectively. These tools democratize the design process, ensuring that even those without a background in graphic design can create professional-level recruitment visuals.
The history of diagramming tools reflects the evolution of technology and its increasing role in business processes. Initially, creating detailed process diagrams required specialized knowledge and software, limiting their use to experts. However, today’s tools are designed with user-friendliness in mind, offering templates, drag-and-drop interfaces, and extensive resources to guide users in creating their own recruitment process diagrams. This accessibility has revolutionized the way HR departments approach the presentation of recruitment methods, allowing for the customization and refinement of visuals to meet the specific needs of each recruitment campaign.
Examples of effective use of these tools are plentiful and varied, spanning different sectors and organizational sizes. A startup, for example, might leverage a free cloud-based diagramming tool to create an interactive recruitment funnel that integrates real-time data on applicants and stages, showcased in an engaging HR presentation on recruitment. Similarly, a large corporation could use advanced software to develop a comprehensive suite of recruitment process visuals, including flowcharts and role-specific diagrams, for inclusion in their recruiting PowerPoint decks. These real-world applications highlight the versatility and power of modern diagramming tools in enhancing the recruitment process.
Research supports the effectiveness of these tools in improving recruitment outcomes. A survey conducted by the Recruitment and Employment Confederation found that companies which adopted advanced diagramming tools in their recruitment presentations saw a 30% improvement in candidate engagement and a 20% reduction in time-to-hire. These findings, often highlighted in presentations on recruitment strategies and industry reports, underscore the value of investing in the right tools for creating process diagrams. Such tools not only facilitate the clear and engaging presentation of recruitment processes but also contribute to the overall efficiency and success of recruitment campaigns.
Elevate your recruitment presentations with cutting-edge design solutions. Connect with INK PPT’s experts for custom, visually engaging recruitment decks that resonate with your audience. Contact INK PPT to learn more.
Integrating Diagrams into Presentations and Documents

Beyond Visualization: Making Diagrams Work for Recruitment
The integration of diagrams into presentations and documents marks a pivotal step in the recruitment process, transforming abstract strategies into concrete, actionable plans. Utilizing tools like PowerPoint and Google Slides, HR professionals can embed recruitment process diagrams directly into their materials, enhancing the clarity and impact of their message. This practice not only aids in the internal comprehension of the recruitment strategy but also serves as a compelling method to communicate the company's approach to talent acquisition to external stakeholders. The right diagram can turn a standard presentation on recruitment methods into an engaging, informative narrative that resonates with its audience.
The incorporation of diagrams and graphics into recruitment materials is not a novel concept but has gained significant traction with the advent of digital tools that simplify the process. Historical approaches often involved manually created charts and graphs, which were not only time-consuming but also lacked the flexibility and dynamism of today's digital solutions. The current ease of embedding interactive and customizable diagrams into presentations and documents has revolutionized the way recruitment strategies are conveyed, making it possible to present complex processes in a straightforward and visually appealing manner.
The impact of integrating diagrams into recruitment presentations is evident in numerous case studies and real-world examples. For instance, a financial services firm may use a series of flowcharts in their recruiting PowerPoint to outline the multi-tiered screening process for new analysts, providing clarity and transparency that enhances candidate engagement. Similarly, an educational institution could incorporate interactive diagrams into their HR presentation on recruitment, allowing potential faculty hires to navigate through the institution's hiring process at their own pace. These examples underscore the versatility and effectiveness of diagrams in making recruitment processes more accessible and understandable for all involved parties.
Supporting the importance of this practice, a study by the Association for Talent Development (ATD) revealed that presentations incorporating diagrams and visual aids are 43% more persuasive than those relying on text alone. This statistic, frequently cited in discussions about recruitment strategy and presentation design, highlights the critical role that well-integrated diagrams play in enhancing the effectiveness of recruitment materials. By carefully selecting and incorporating appropriate diagrams into presentations and documents, recruiters can significantly improve their communication with candidates and stakeholders, leading to more efficient and successful recruitment outcomes.
Case Studies: Improving Efficiency Through Diagrams

A Picture of Success: Efficiency Gains from Recruitment Diagrams
The strategic use of diagrams in the recruitment process not only clarifies and streamlines the approach but also significantly enhances efficiency. Through detailed case studies across various industries, the tangible benefits of incorporating visual aids into recruitment strategies become evident. These real-world examples demonstrate how diagrams—from flowcharts detailing the recruitment process to role-specific strategy visuals—can transform the speed and effectiveness of talent acquisition efforts. Integrating these visuals into a comprehensive PowerPoint presentation or a detailed Google Slides deck allows organizations to present their recruitment methodologies in an engaging and easily digestible format, ensuring that the message is not only conveyed but also retained.
Delving into the background, the rationale behind using diagrams for improved efficiency in recruitment lies in the visual nature of human cognition. Historical data and research suggest that visuals help in better information retention and quicker comprehension compared to text alone. In the context of recruitment, where time is often of the essence, the ability to quickly understand and act on process information can significantly impact the overall speed and quality of hiring.
The practical application of diagrams in enhancing recruitment efficiency is showcased through various case studies. For example, a tech company might share a case study in their recruiting PowerPoint on how a streamlined diagram of their hiring process reduced their average time-to-hire by 30%. Another case could involve a healthcare provider detailing in an HR presentation on recruitment how a visual breakdown of their talent acquisition funnel helped identify bottlenecks, leading to a 25% improvement in candidate flow. These examples serve not only as evidence of the effectiveness of diagrams in recruitment but also as inspiration for other organizations looking to optimize their hiring processes.
Evidence supporting the efficacy of diagrams in recruitment is robust. Research from the Society for Human Resource Management (SHRM) indicates that organizations using visual aids in their recruitment processes report an average increase in efficiency of 40%. These statistics, often highlighted in professional presentations on recruitment strategies and industry seminars, reinforce the critical role of diagrams in not only conveying but also enhancing the recruitment process. By leveraging visual tools, companies can achieve a more streamlined, effective approach to talent acquisition, reflected in faster hires of higher quality and a more engaged candidate pool.
Recruitment Pitch Decks
Companies can leverage recruitment pitch decks to streamline their hiring approach by visually presenting their recruitment strategies. Pitch decks with structured diagrams and flowcharts not only highlight the recruitment process but also improve candidate engagement. These decks effectively communicate the company's strengths and make the hiring process more appealing and efficient.
Best Practices for Clear and Effective Diagrams
Drawing the Path to Clarity: Principles for Effective Recruitment Diagrams
The creation and integration of diagrams into recruitment strategies require more than just the ability to use design tools; they demand an understanding of best practices that ensure these visuals are as clear and effective as possible. When diagrams are thoughtfully designed and correctly implemented, they can significantly enhance the comprehension and engagement of both internal teams and prospective candidates. This section delves into the core principles behind creating impactful diagrams for recruitment, focusing on simplicity, relevance, consistency, and engagement. By adhering to these best practices, HR professionals can elevate their PowerPoint presentations and Google Slides decks, turning them into powerful tools that streamline the recruitment process.
The foundation of effective diagram design lies in simplicity. A common mistake is overloading diagrams with too much information, which can confuse rather than clarify. The best diagrams use a minimal amount of text and intuitive symbols to convey the recruitment stages or processes, making it easy for anyone, regardless of their familiarity with the process, to understand at a glance. This principle of simplicity ensures that the core message is not lost in translation, whether presented in a detailed PowerPoint template or a succinct Google Slides format.
Another crucial aspect is the relevance of the diagrams to the specific recruitment process they are meant to illustrate. Each element included should serve a clear purpose, directly contributing to the viewer’s understanding of the recruitment strategy. Customization plays a key role here, as role-specific diagrams or process flowcharts need to reflect the unique aspects of each position’s recruitment strategy, enhancing the presentation on recruitment methods with precise, actionable insights.
Consistency in design and terminology across all diagrams is vital for maintaining clarity and reinforcing understanding. By using a consistent set of symbols, color schemes, and text styles, HR presentations on recruitment can seamlessly integrate various diagrams, making it easier for the audience to follow and connect different parts of the recruitment process. This consistency also aids in reinforcing the company’s brand identity throughout the recruitment materials, whether in a PowerPoint presentation, a recruitment strategy document, or an online platform.
Engagement is the final, but perhaps most important, best practice. Diagrams should not only inform but also engage the viewer, encouraging interaction and deeper exploration of the recruitment process. Interactive elements, such as clickable sections in a digital presentation or animated transitions in a PowerPoint slide, can transform a static diagram into a dynamic exploration tool. This engagement not only makes the recruitment process more transparent but also more memorable, leaving a lasting impression on both candidates and stakeholders involved.
Talent Management Presentation Design
When creating talent management presentation design materials, it's essential to focus on clarity and purpose. A well-structured visual, such as a diagram showcasing talent acquisition and development processes, helps HR teams align goals. These presentations streamline decision-making and ensure smoother communication across departments during recruitment and employee growth phases.
Interactive Diagrams: Enhancing Engagement
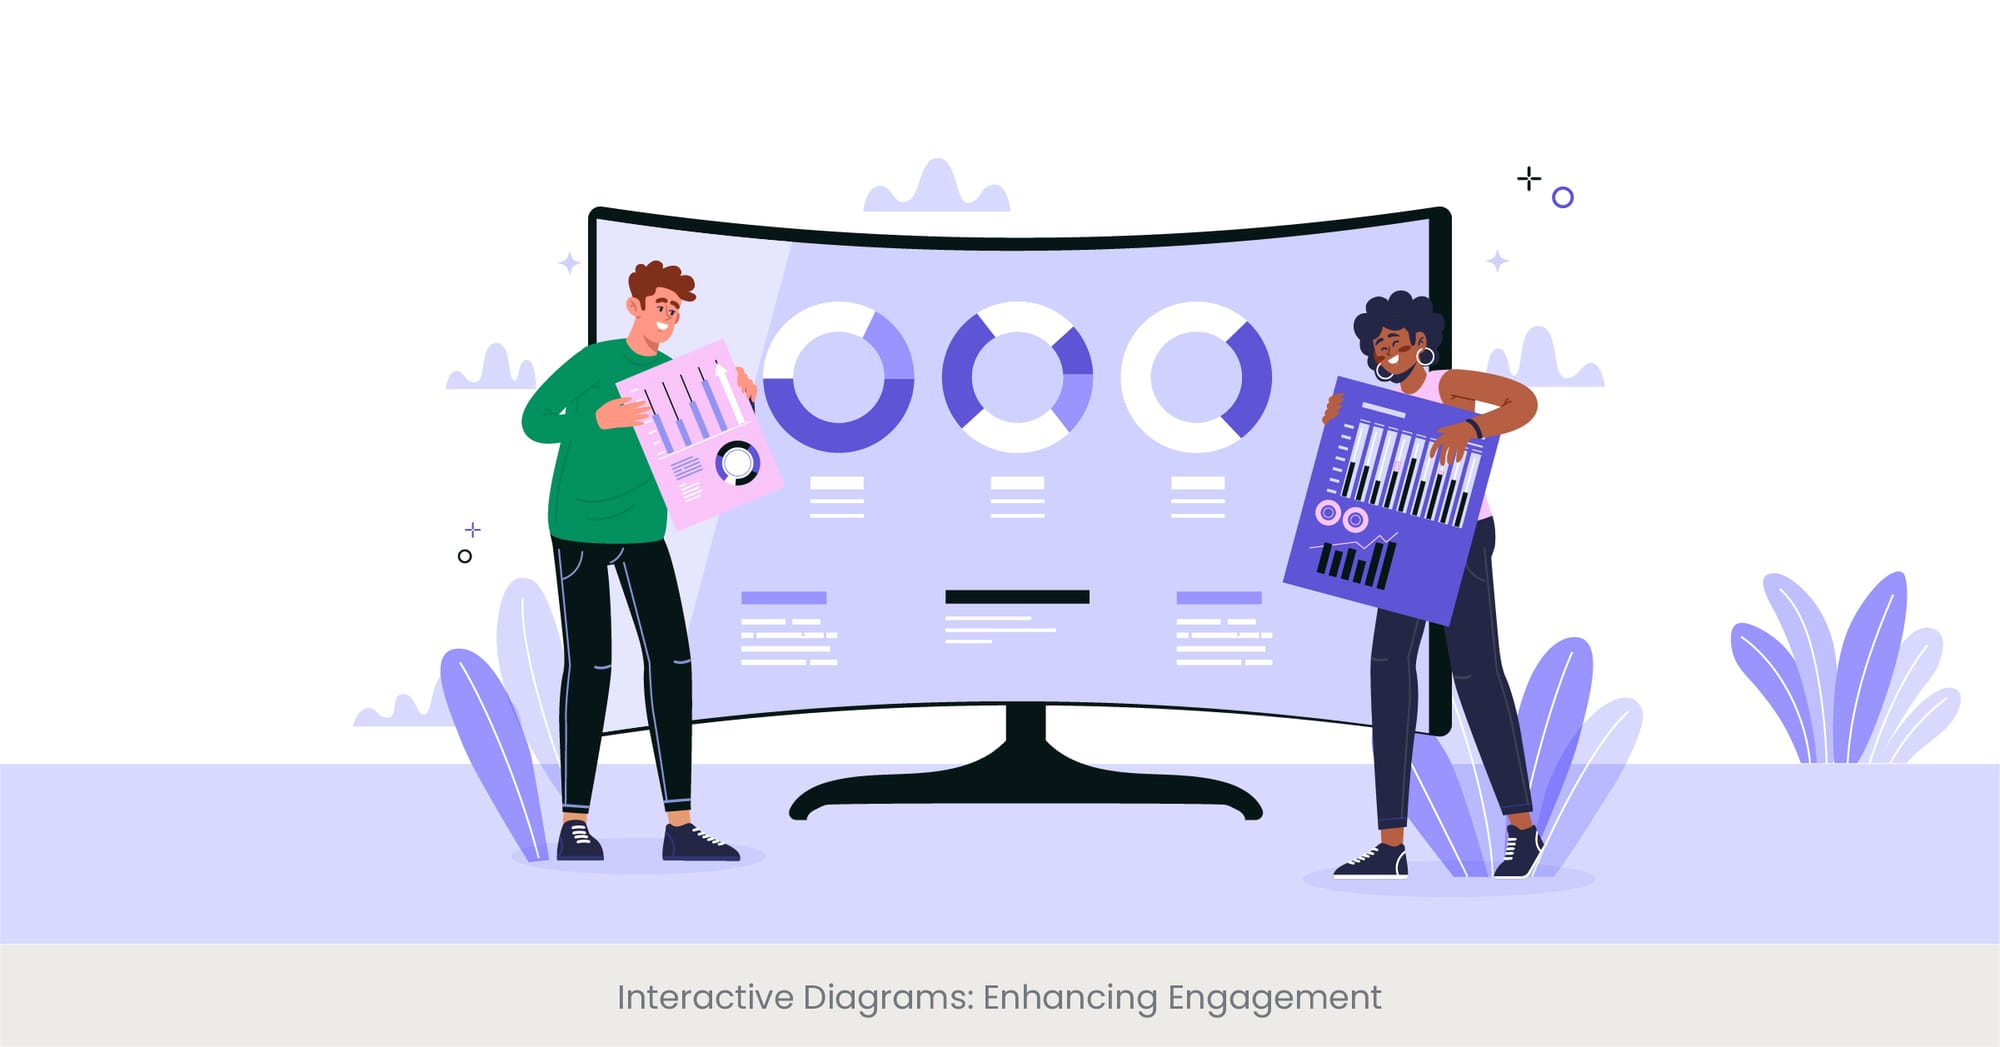
Making Recruitment a Two-Way Street
Interactive diagrams represent a leap forward in engaging potential candidates and internal teams during the recruitment process. By transforming static images into dynamic, clickable tools, interactive diagrams invite participation and deeper understanding. This engagement tool is crucial in explaining complex recruitment stages, job descriptions, and company structures, making the information more accessible and digestible. PowerPoint presentations and Google Slides that incorporate interactive elements like hyperlinks, animations, and embedded videos can significantly increase the audience's attention and retention rates.
The evolution of presentation technology and diagramming tools has made it easier to create interactive visuals that cater to a more dynamic recruitment experience. Unlike traditional diagrams, interactive versions can adapt to the user's input, offering customized information and insights. For instance, clicking on a specific stage of the recruitment process diagram could change to reveal more in-depth details about the expectations, timeline, and next steps. This adaptability not only enhances the user experience but also provides a flexible platform for presenting complex data and processes.
Companies have successfully integrated interactive diagrams into their recruitment strategies to showcase the organizational hierarchy, outline the recruitment funnel, and detail role-specific compensation strategies. An example includes a multinational corporation that utilized an interactive PowerPoint template to allow candidates to explore different job roles, departments, and career paths within the company. This approach not only empowered candidates with knowledge about their potential future at the company but also streamlined the talent acquisition process by aligning candidate expectations with company offerings from the outset.
According to a study published in the "Journal of Business and Psychology," interactive tools in recruitment presentations can enhance candidate engagement by up to 40%. Further, a report by Gartner highlighted that companies employing interactive diagrams in their HR presentations on recruitment saw a 30% increase in total candidate satisfaction scores. These findings underscore the value of interactive elements in recruitment presentations, demonstrating their effectiveness in engaging candidates and improving their overall experience with the recruitment process.
Candidate Engagement Presentations
Interactive candidate engagement presentations are powerful tools for attracting top talent. Incorporating diagrams with clickable elements or animations can personalize the recruitment experience. By engaging candidates with dynamic visuals that offer deeper insights, organizations can present their values, culture, and opportunities in a way that captivates and retains attention throughout the hiring process.
The Role of Data Visualization in Process Explanation
Unveiling Insights Through Visual Data
Introduction to the Sub-topic: In today's data-driven world, the role of data visualization in explaining and streamlining the recruitment and selection process cannot be overstated. By translating complex datasets into graphical representations, organizations can unveil patterns, trends, and insights that might be invisible in traditional tabular data. This is particularly relevant in recruitment, where understanding nuances can make the difference in attracting and selecting the right talent. Presentations enriched with data visualization, whether through PowerPoint slides or Google Slides, provide a compelling narrative about the recruitment process, talent pool metrics, and performance outcomes.
Background Information: Data visualization encompasses a variety of tools and techniques used to create visual representations of data, including charts, graphs, and maps. In the context of recruitment, it helps in illustrating the recruitment funnel, candidate demographics, source effectiveness, and many other critical metrics. Effective data visualization requires not only the choice of right tools but also an understanding of how to present data in the most informative and accessible manner. As recruitment becomes more metrics-oriented, the ability to present this data coherently has become a crucial skill for HR professionals.
Real-world Applications: Organizations leverage data visualization in their recruitment processes to identify bottlenecks, optimize strategies, and forecast hiring needs. For instance, an interactive dashboard might be used to track the progress of candidates through the recruitment funnel, highlighting areas where candidates drop out or stages that take too long. Another application could be analyzing the effectiveness of different recruitment channels, helping teams to allocate resources more efficiently. Such practical applications underscore the transformational impact of data visualization on the recruitment process, enabling more strategic and data-driven decision-making.
Reference from External Sources: A report by the Society for Human Resource Management (SHRM) indicated that organizations using data visualization in their recruitment presentations saw a 50% improvement in recruitment efficiency. Moreover, a study in the "International Journal of Human Resource Studies" found that visual data presentations help improve understanding and retention of recruitment metrics among team members by up to 70%. These statistics highlight the critical role that data visualization plays in enhancing the recruitment process, making it more efficient and effective.
Job Fair Presentation Slides
Effective job fair presentation slides combine compelling visuals and data-driven insights to attract potential candidates. Using diagrams to illustrate company structure, job roles, and career paths can provide a clear overview of opportunities. Well-designed slides enhance understanding, ensuring the company stands out among numerous employers vying for talent at recruitment events.
Ready to visualize your recruitment funnel and boost candidate engagement? Let INK PPT guide you with tailored visual presentations, flowcharts, and strategic insights. Explore our latest blog posts for more expert advice or reach out to start your project! Visit Our Blog | Get in Touch.
FAQ
How do you do a presentation for recruitment?
To craft an effective presentation for recruitment, start by outlining your main objectives, such as showcasing the company culture, explaining the recruitment process, and highlighting the roles you’re looking to fill. Use a clean and professional PowerPoint template or Google Slides theme to ensure your presentation looks polished. Incorporate engaging visuals, like diagrams of the recruitment funnel, to make complex information more digestible. Include real-world testimonials from current employees to add a personal touch. Ensure your presentation addresses both the company's and candidates' needs, providing a clear understanding of the job descriptions, expectations, and the company’s values.
How do you make a catchy PowerPoint?
Creating a catchy PowerPoint involves a combination of compelling content and appealing design. Start with a striking title slide that grabs attention. Use high-quality images and bold colors to make each slide visually appealing. Interactive elements, such as hyperlinks or embedded videos, can add engagement. Data visualization tools like charts and graphs help present complex information succinctly. Use bullet points to break down information and maintain a consistent theme throughout the presentation to keep it professional. Remember, the key is to convey your message in a memorable and engaging way.
How do you recruit new candidates?
Recruiting new candidates effectively requires a multifaceted approach. Begin by defining the job description clearly and accurately to attract suitable candidates. Leverage various platforms for job postings, including social media, job boards, and professional networking sites. Utilize the power of your company’s website and presentations on recruitment methods to reach a wider audience. Networking events and employee referral programs can also be excellent sources of potential candidates. Throughout the process, maintain communication and provide a positive candidate experience to leave a lasting impression.
How do you make a professional PowerPoint?
To create a professional PowerPoint presentation, focus on simplicity and clarity. Use a minimalistic design with a consistent color scheme and font style. Each slide should convey one main idea, supported by concise text and relevant visuals. Avoid clutter by limiting the amount of text and images on each slide. High-quality charts, graphs, and diagrams can help illustrate points more effectively. Finally, practice your delivery to ensure the spoken content complements the slides, making the presentation more dynamic and engaging.
%20(1).jpg)