
Contact Us
Let’s Partner for Your Next Big Presentation
Consult with our Business Advisor
.webp)
Thank you! Your submission has been received!
Oops! Something went wrong while submitting the form.

Prefer to watch? Here's a quick walkthrough of the process:
When your team needs to describe a process during a presentation, PowerPoint is likely already open on your computer. Yet, you will often find yourself going outside of the programme to build your PowerPoint diagram tutorial because it feels easier to do so. The problem with that approach is that it takes additional time to format and integrate it into the presentation.
There are two ways of making a process diagram natively in PowerPoint. Firstly, you can take advantage of SmartArt graphics that come pre-packaged with PowerPoint to create your PowerPoint diagram tutorial in no time. Secondly, you can build a custom flowchart by hand from shapes. Both ways are available from the same Insert tab, so we will start by looking into SmartArt.
SmartArt graphics let you create PowerPoint diagram tutorial designs with ease because all you have to worry about is the content. PowerPoint will automatically handle alignment, spacing, colour and much more for you, which is essential if you are building your slides quickly.
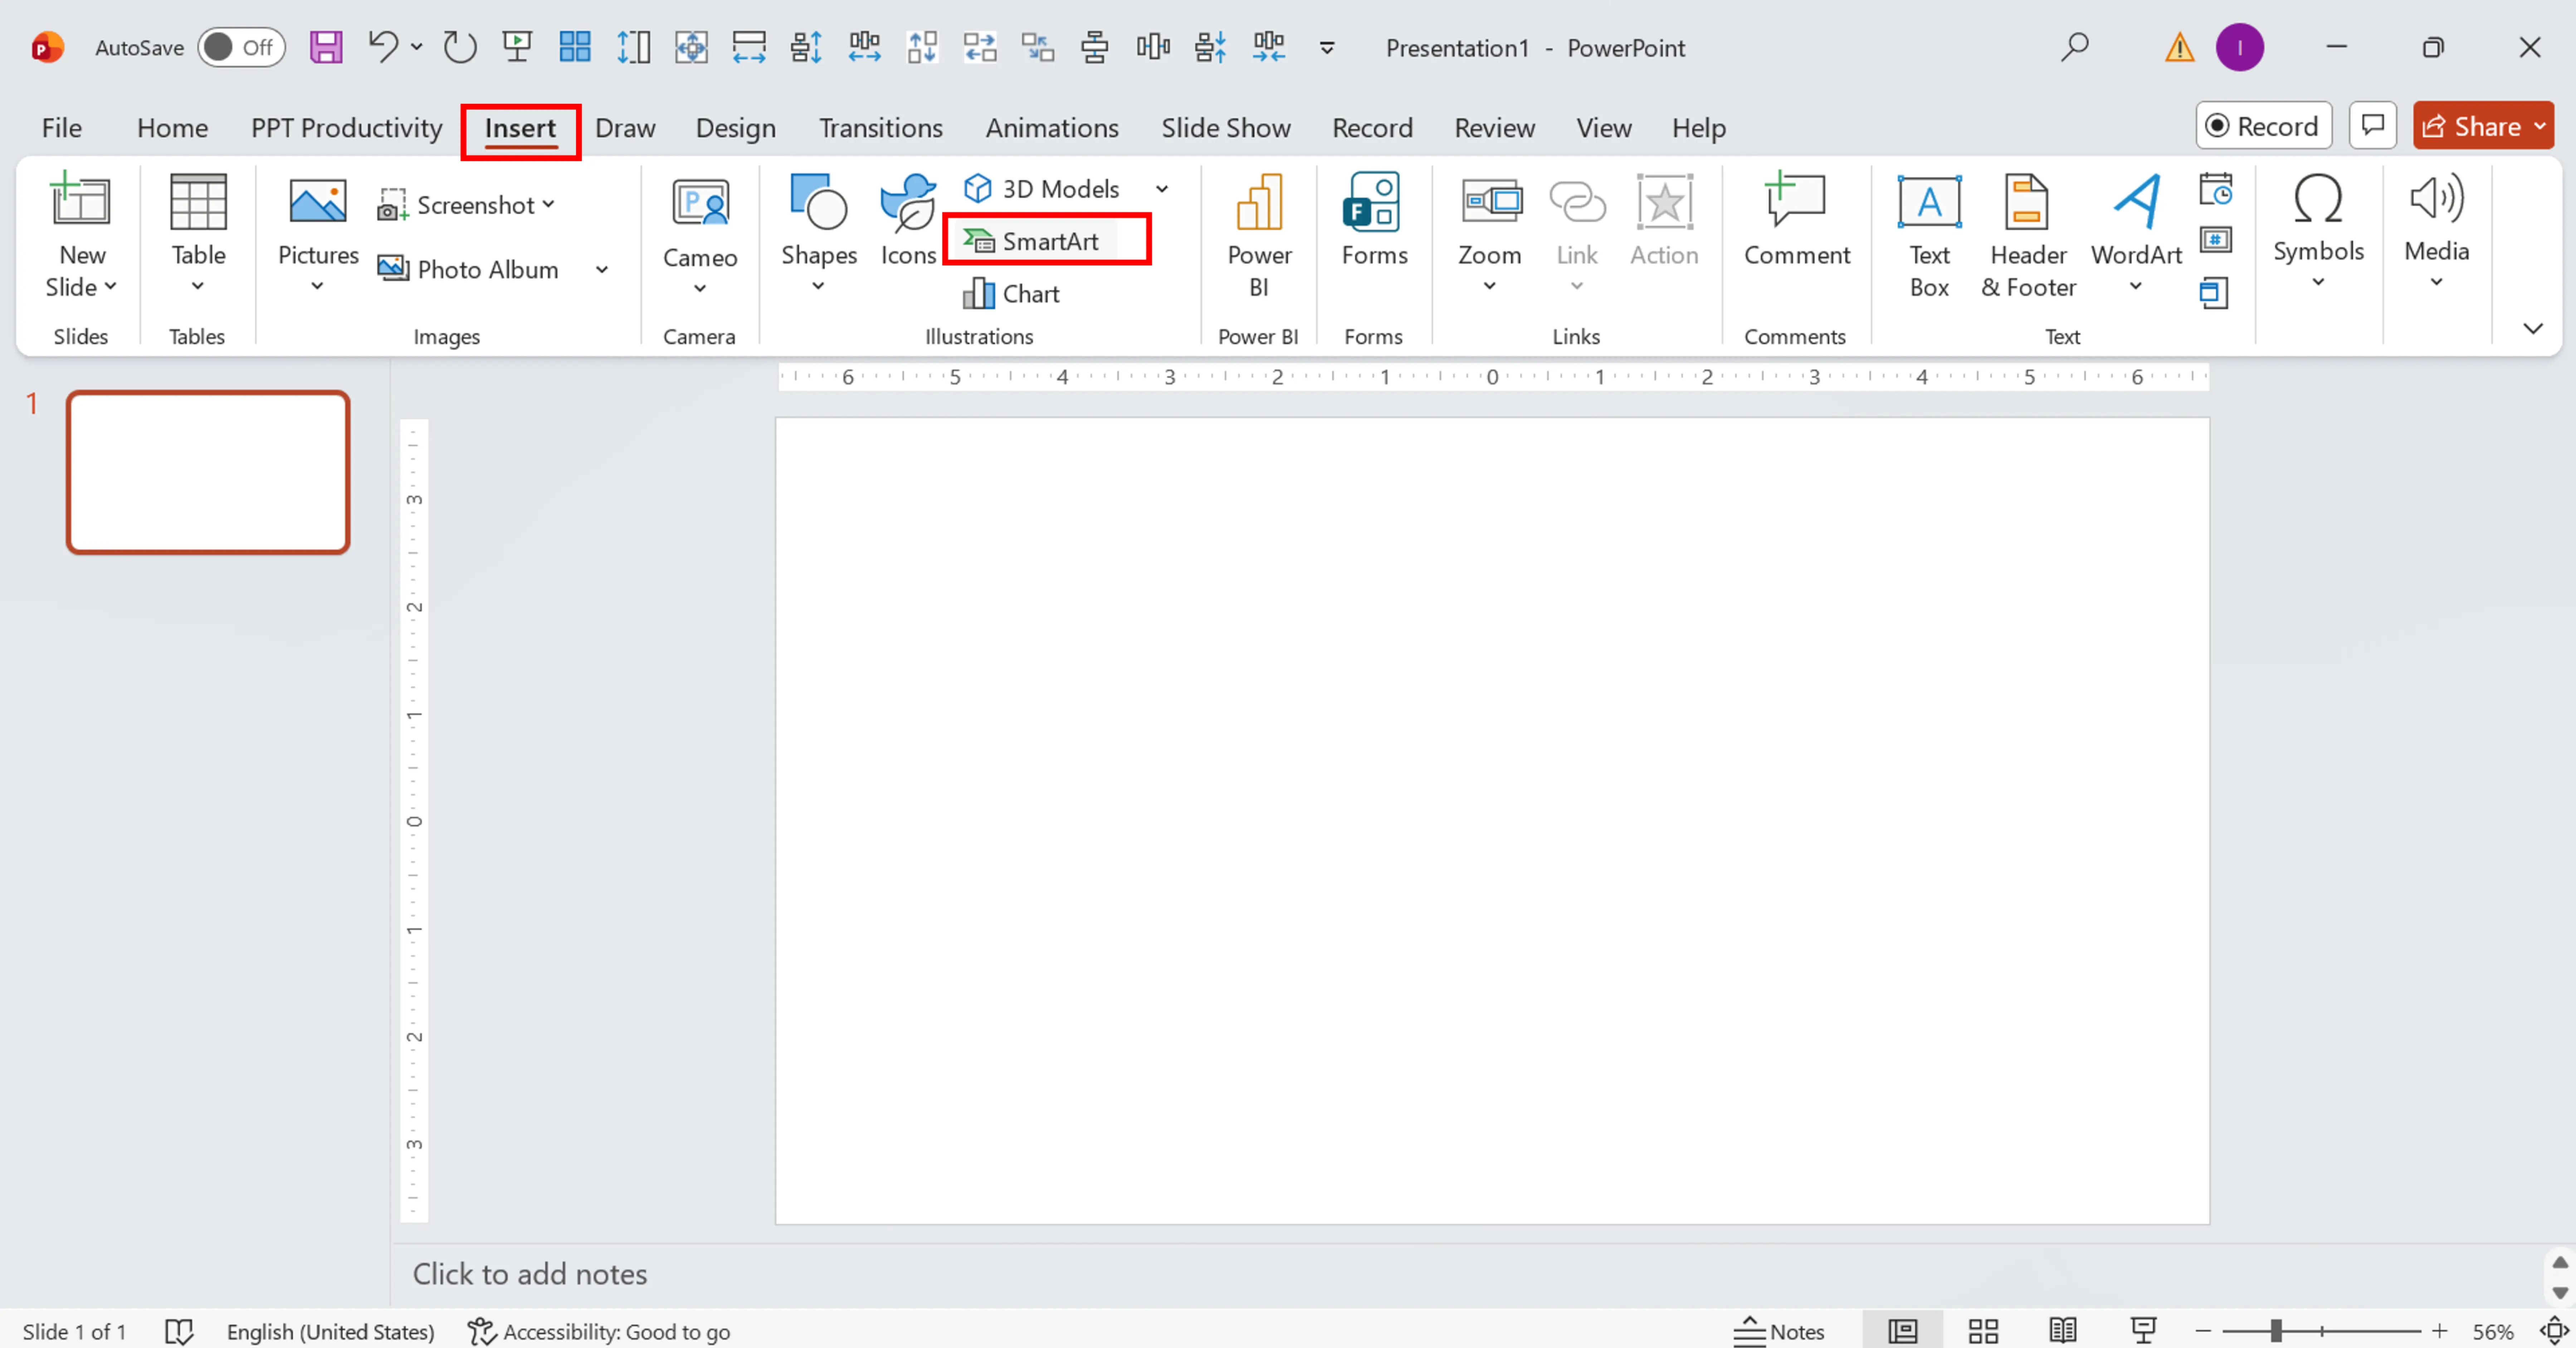
Launch PowerPoint, open the slide where the flowchart should go, and switch to the Insert tab. There, you'll find the SmartArt option. Clicking on it opens the dialogue box with a category navigation list on the left.
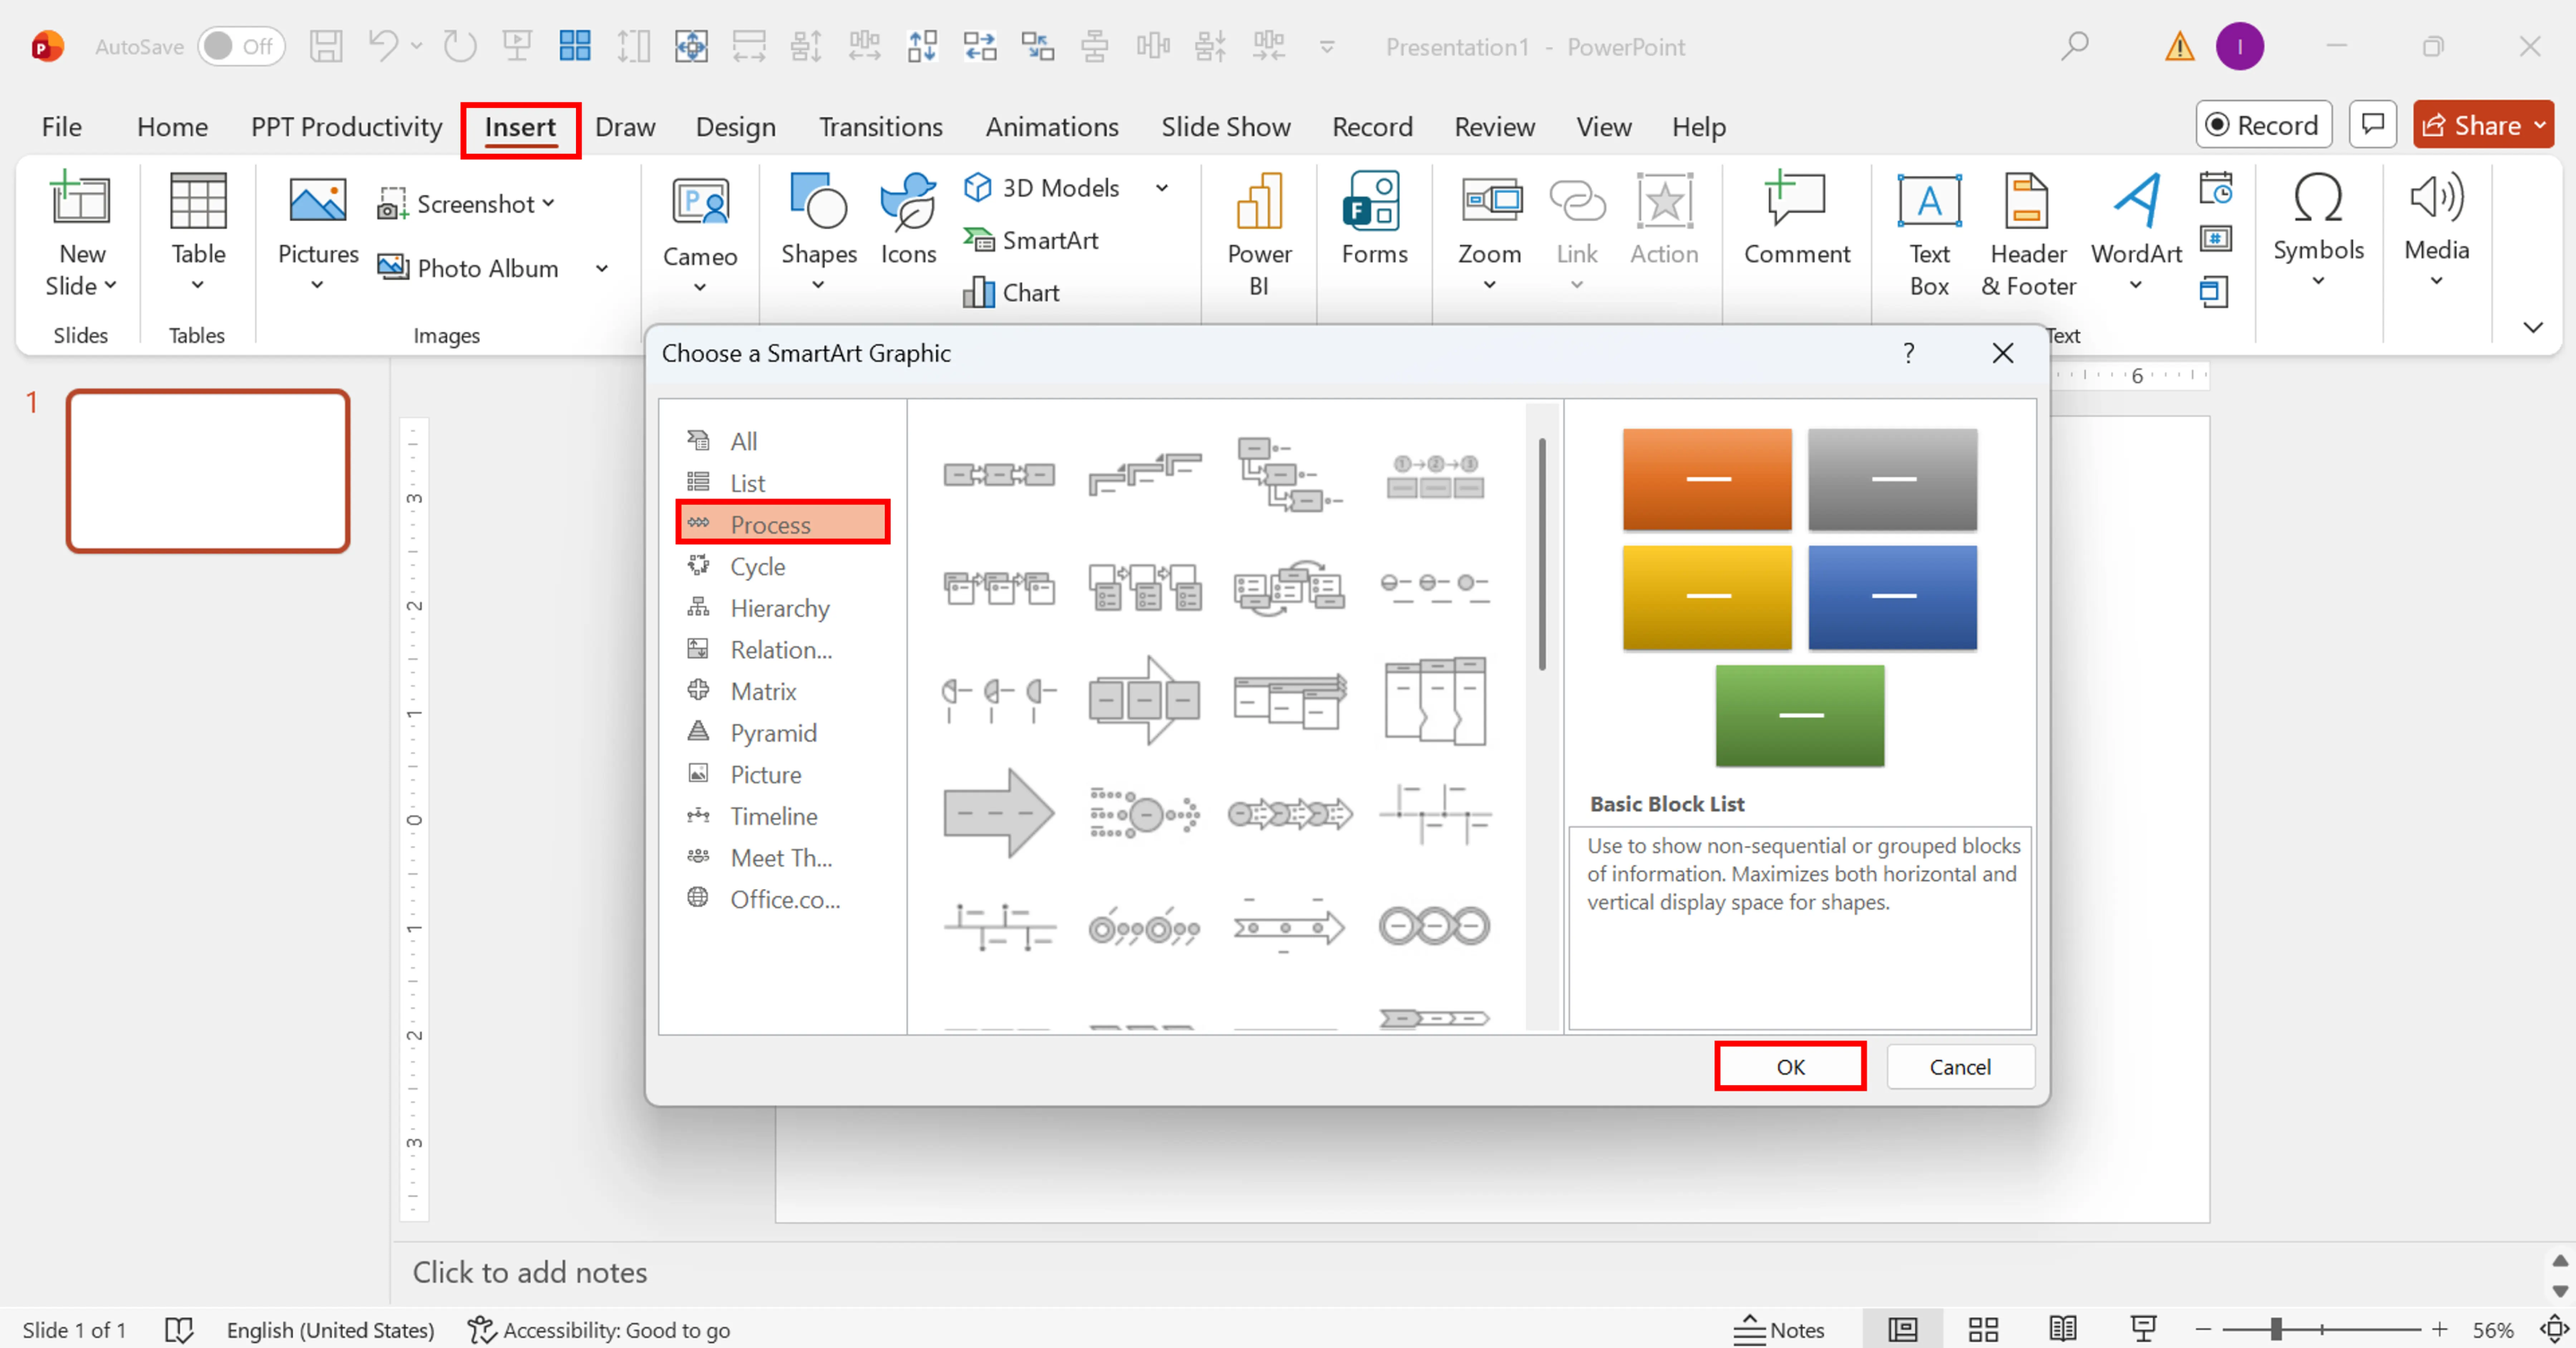
Navigate to the Process category on the left and click on it. This category is dedicated to process flowcharts, timelines and other structured processes. There are dozens of layout types for you to choose from.
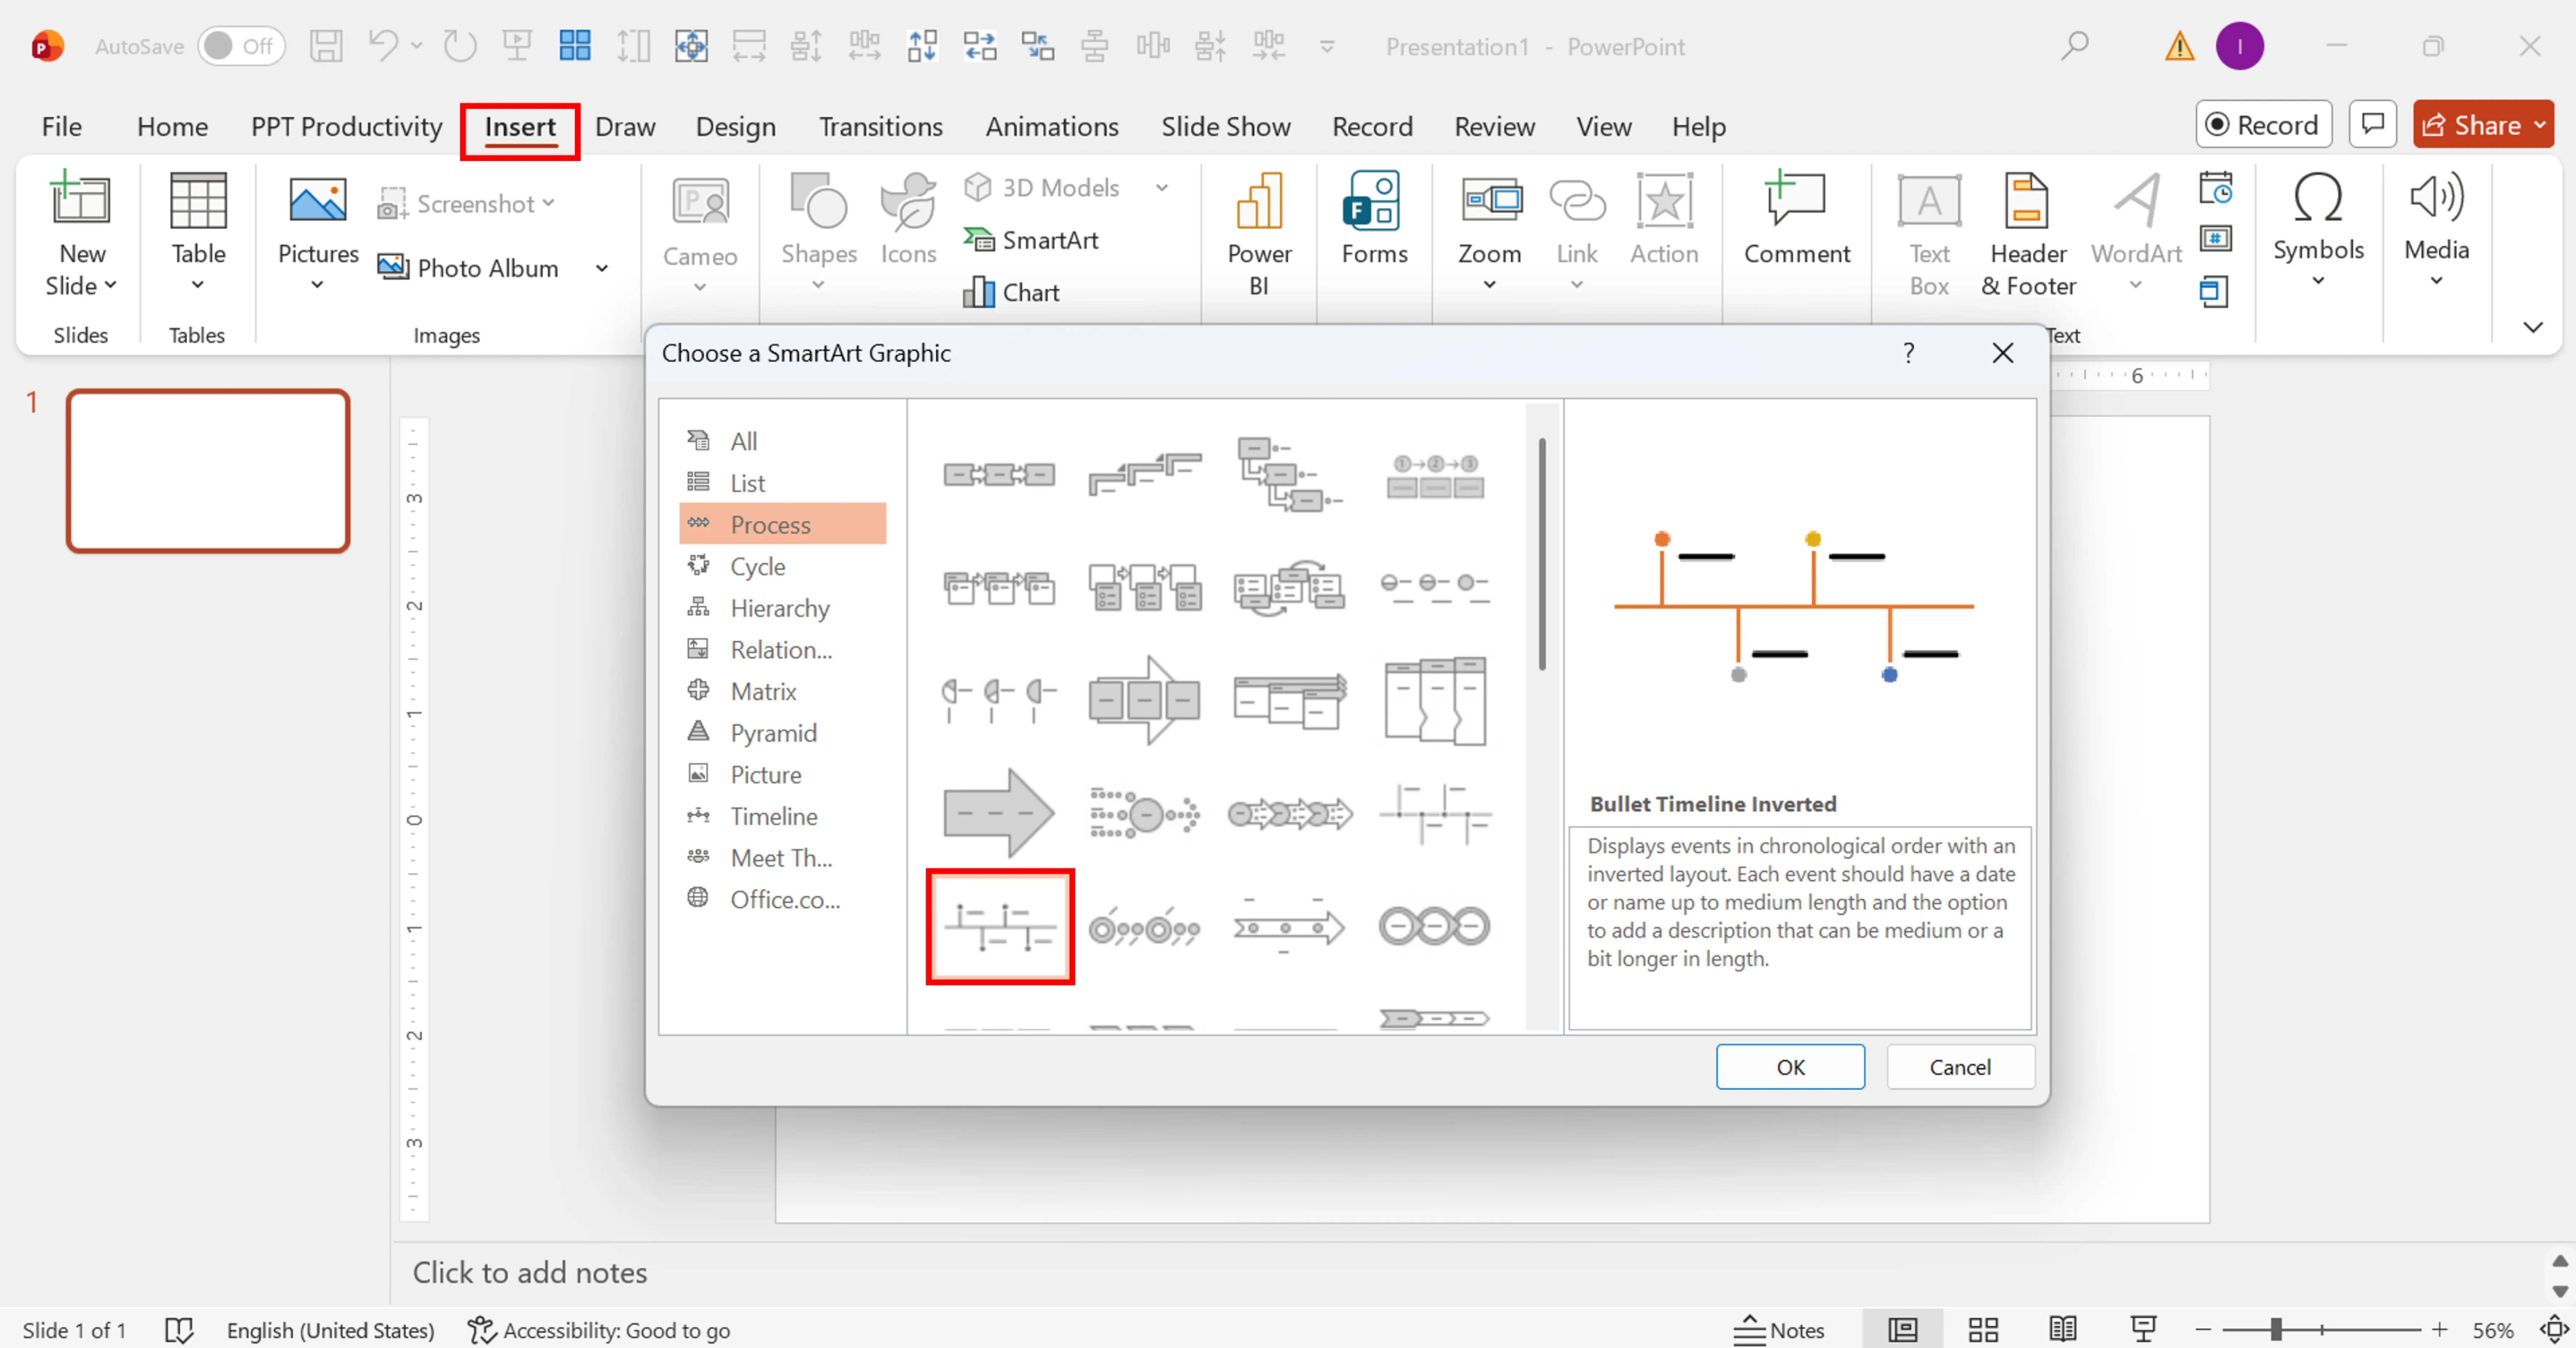
Choose Bullet Timeline Inverted from among all the process layouts available. The benefit of this layout is that it includes primary actions along the horizontal axis with detailed information about those actions as the bullets underneath them. Hit the OK button to add this layout to your presentation.
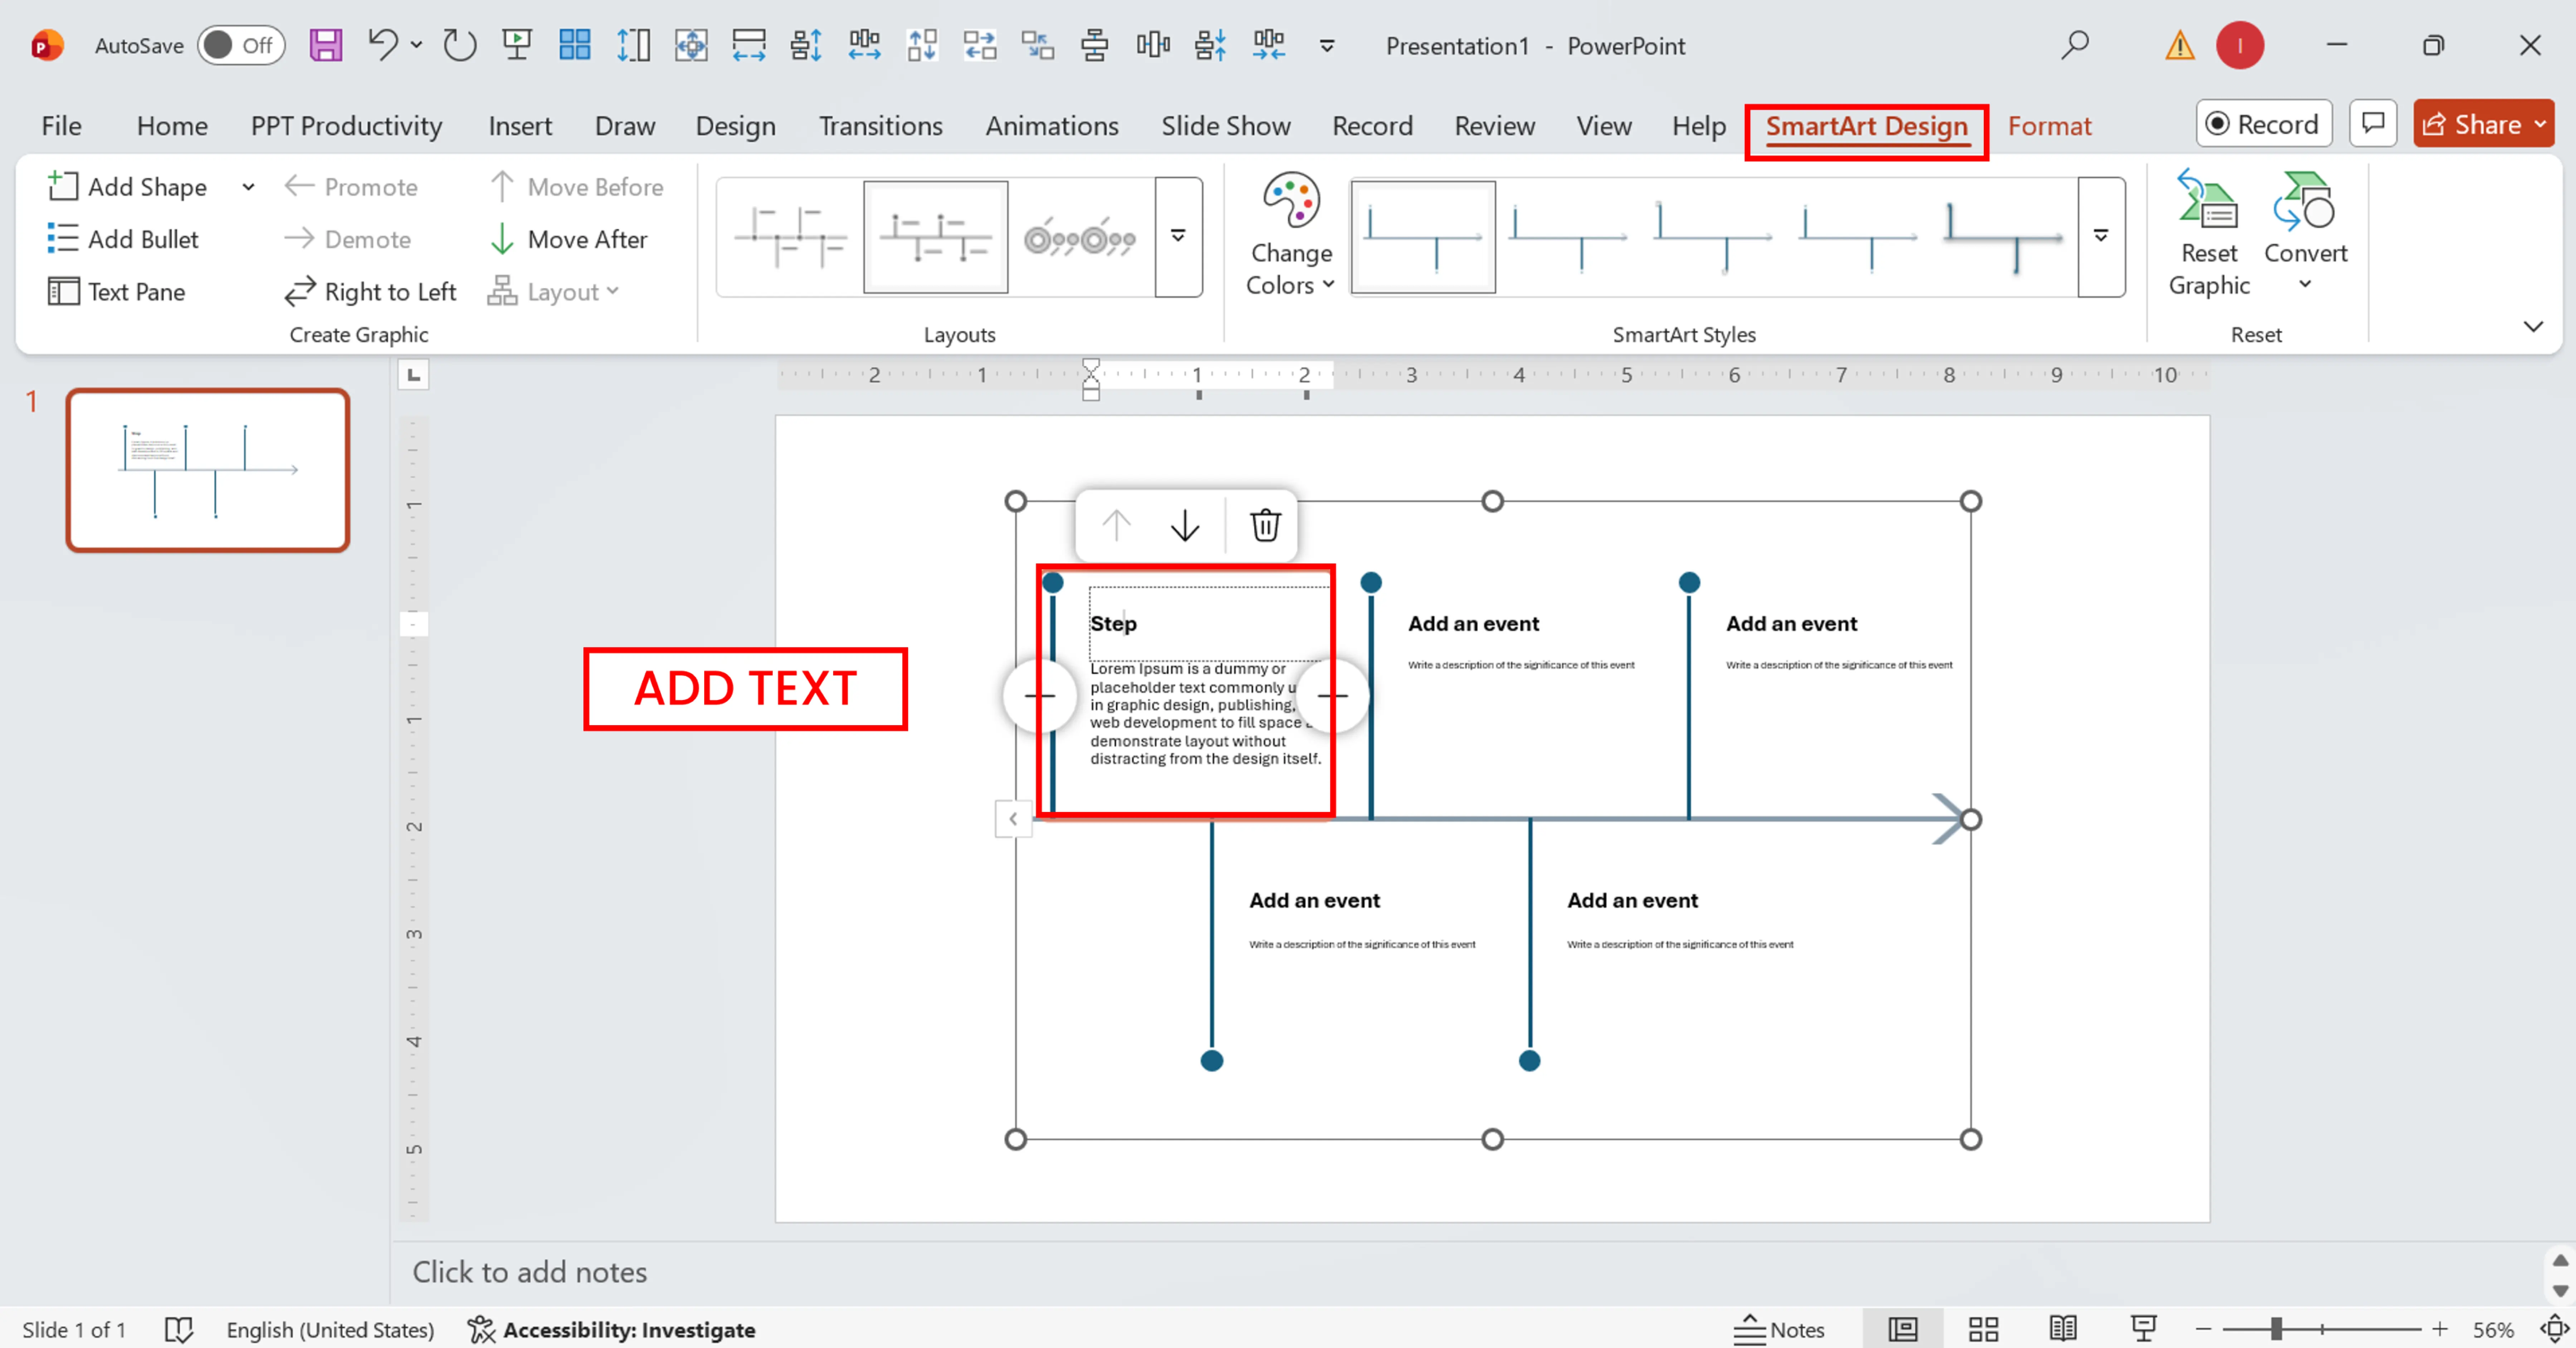
Type in the name of your first step into a text box within the SmartArt. Hit Tab button or click directly on another box to move from one step to another. Each of the top boxes represents one of your process stages. Each indented text box underneath represents the bullet for that particular action step.
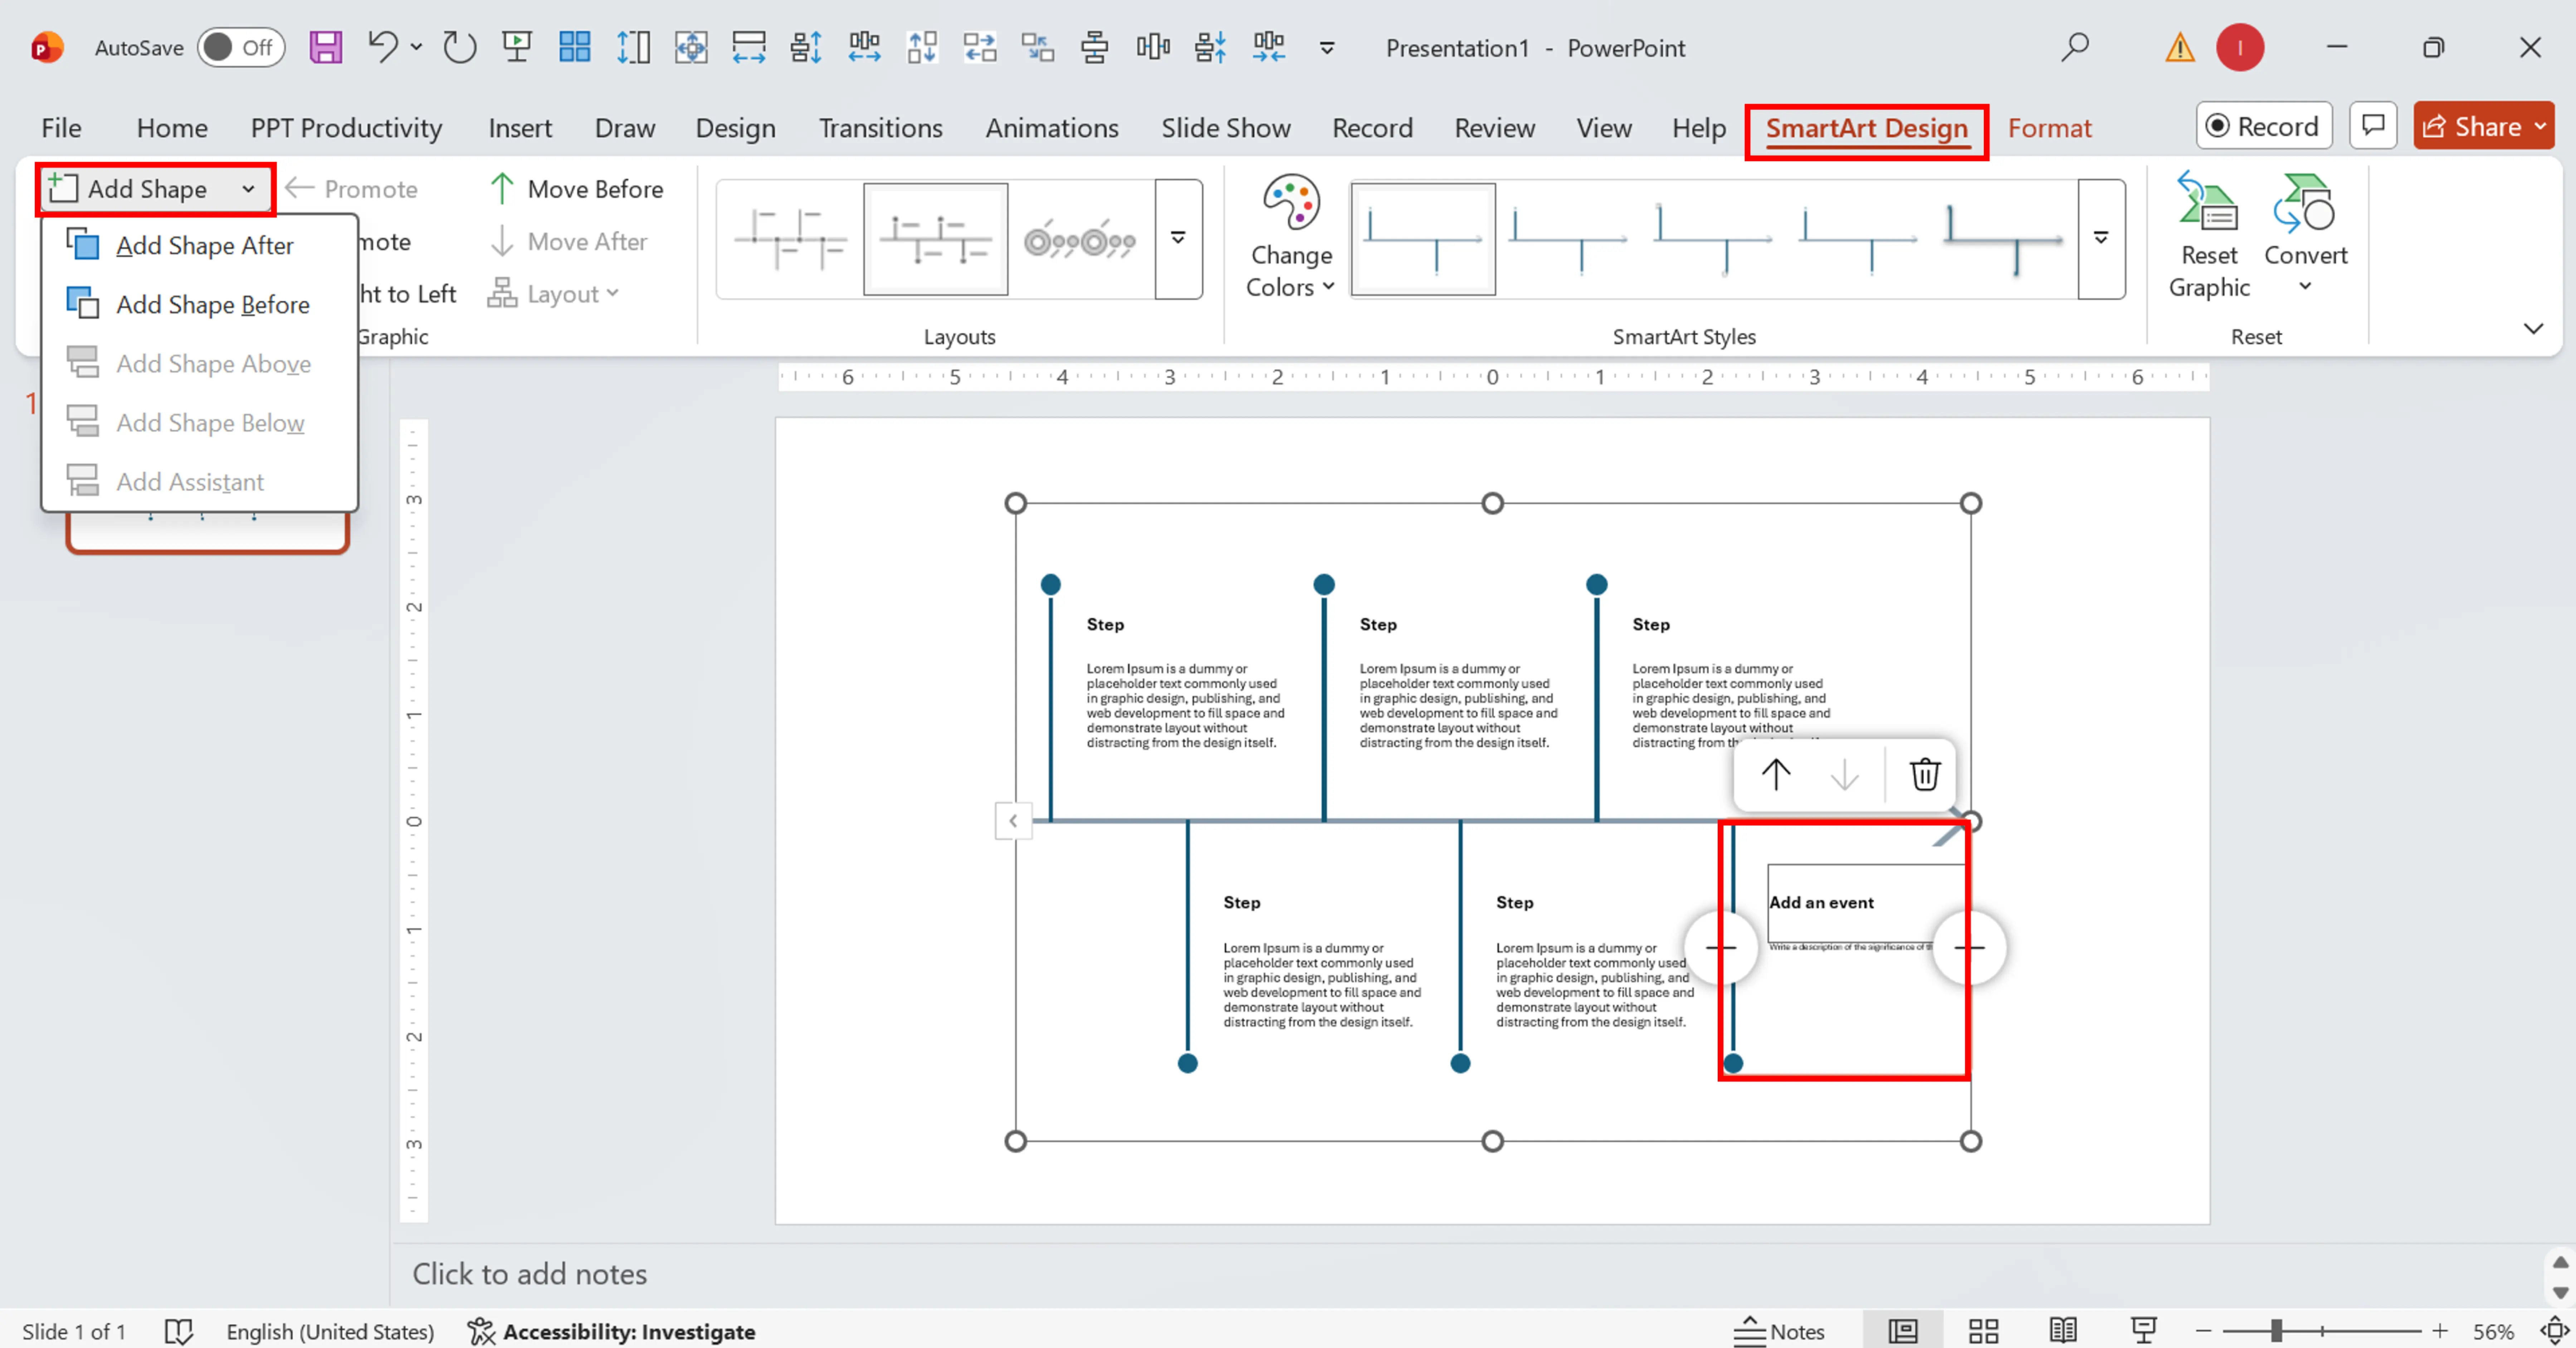
There are two ways to add more stages into the SmartArt:
Text Pane: You can open it with the button on the left side of the SmartArt and just press the Enter button once you reach the last item;
Add Shape: Right-click on an existing shape, select Add Shape, and choose Add Shape After or Add Shape Before according to your needs.
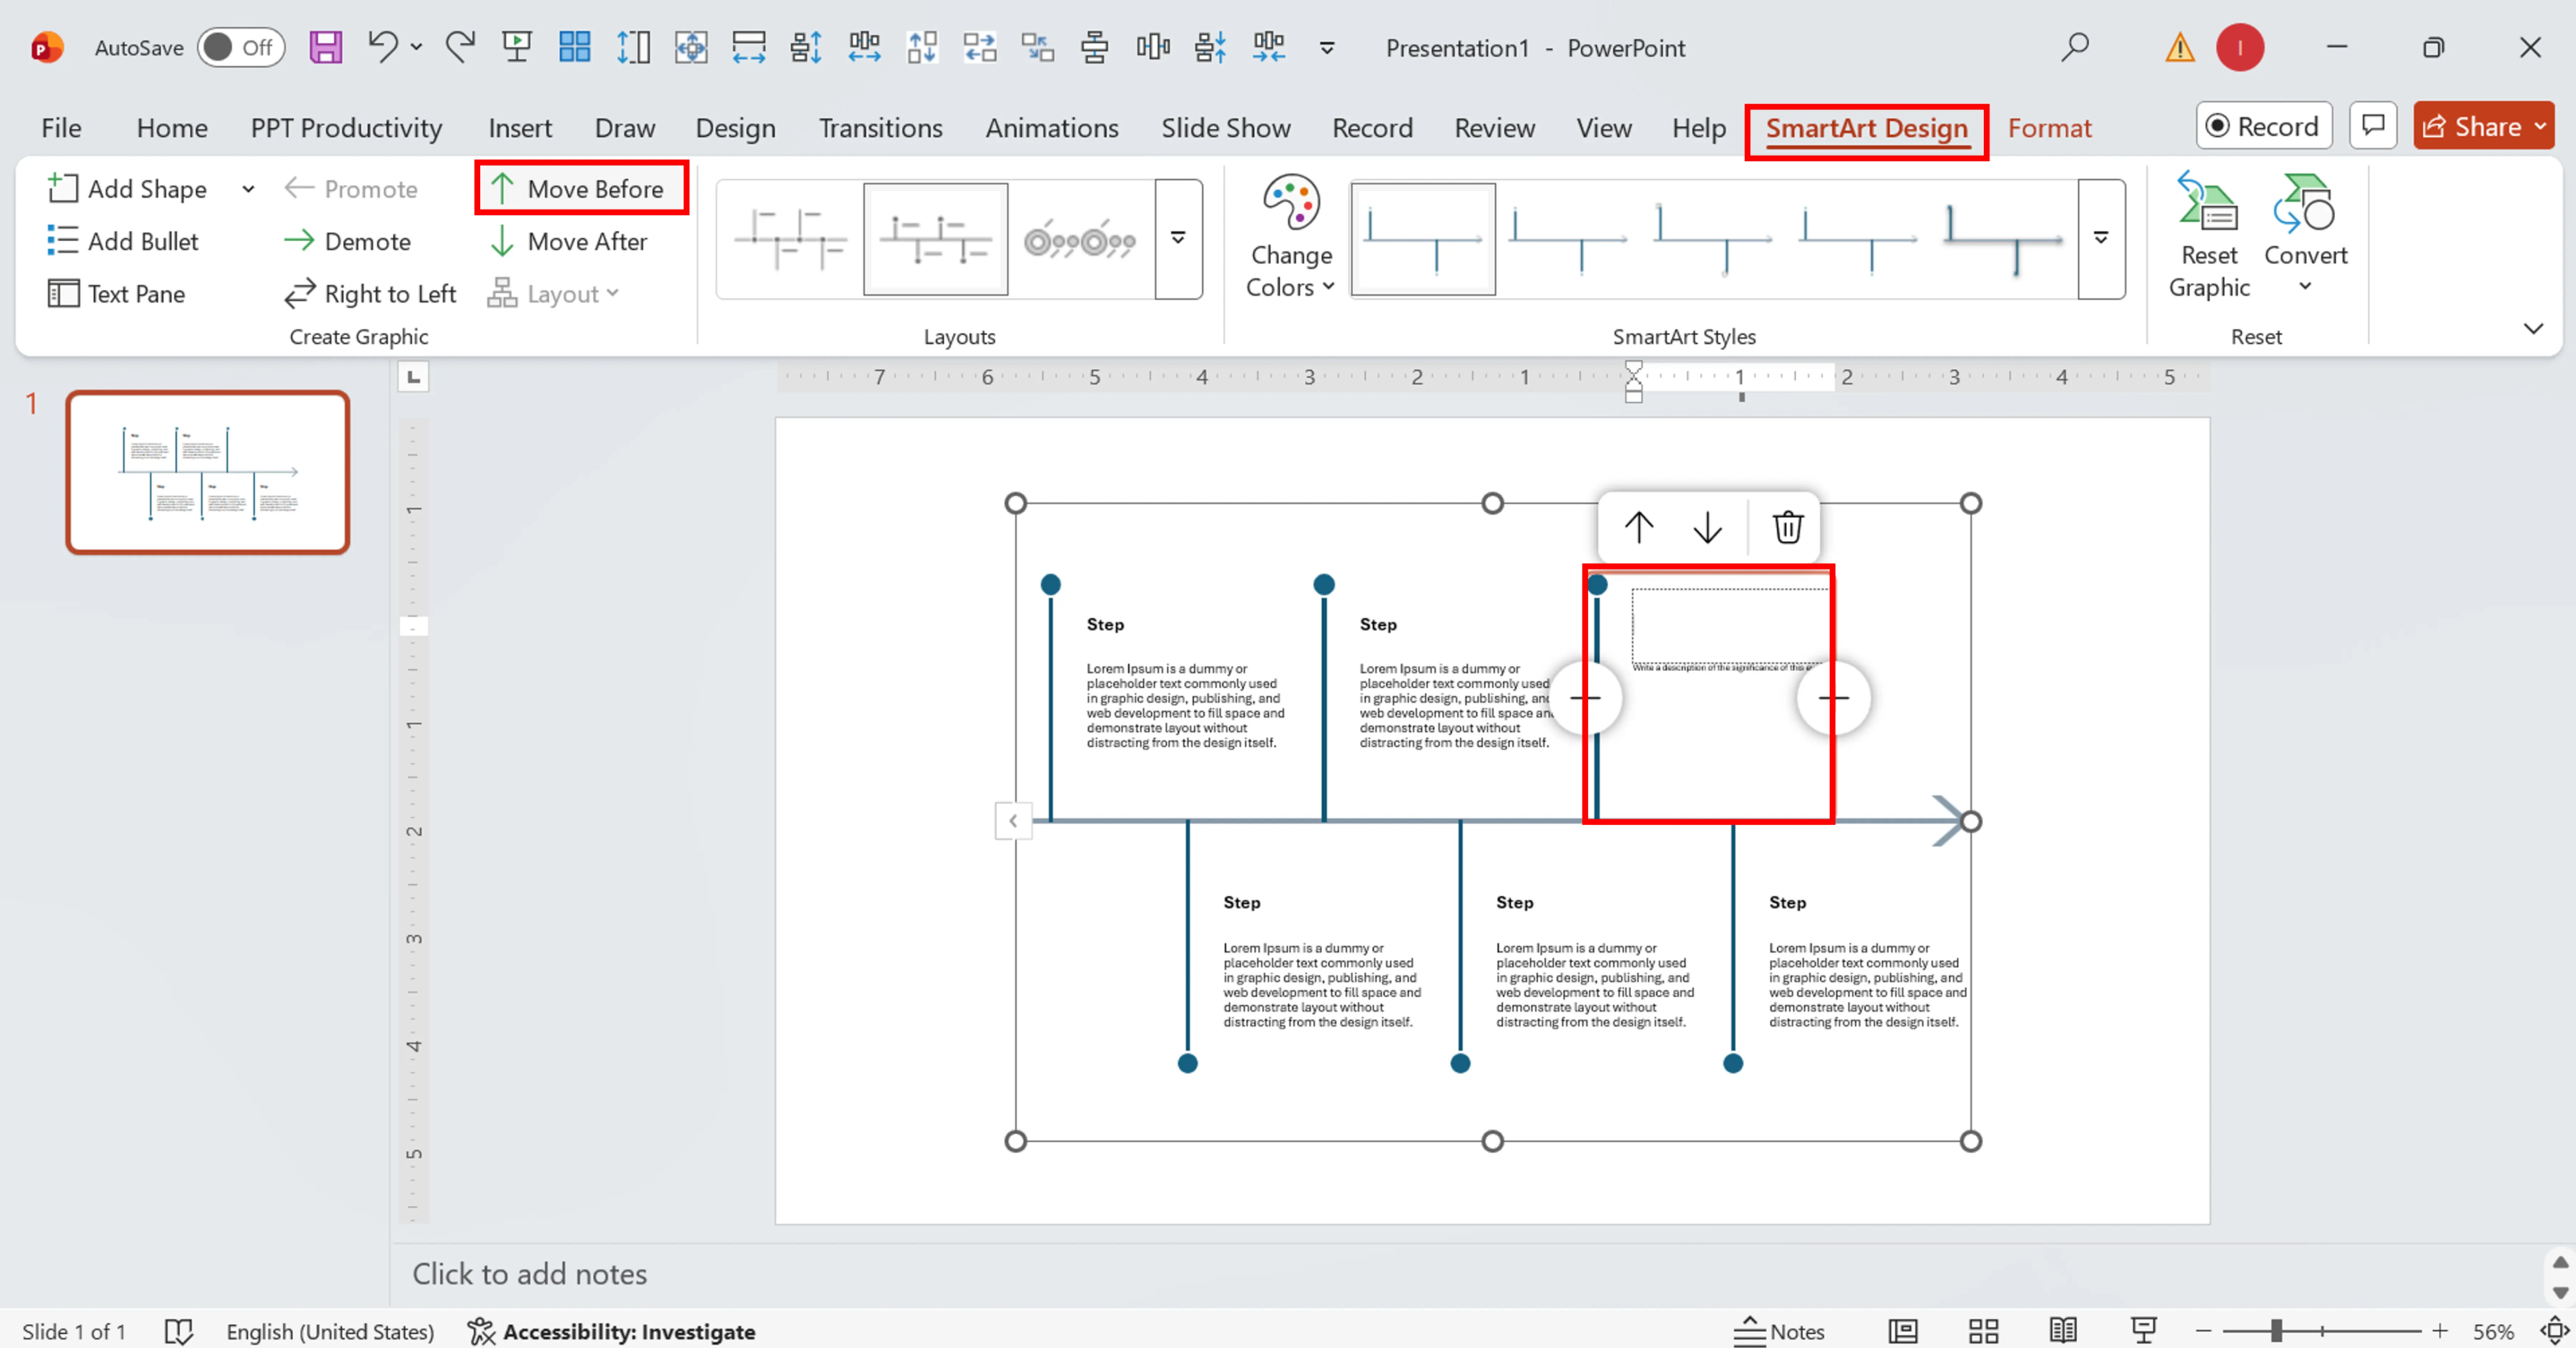
Simply pick any shape within the diagram and navigate to the Move Up and Move Down buttons within the SmartArt Design tab (Create Graphic group).
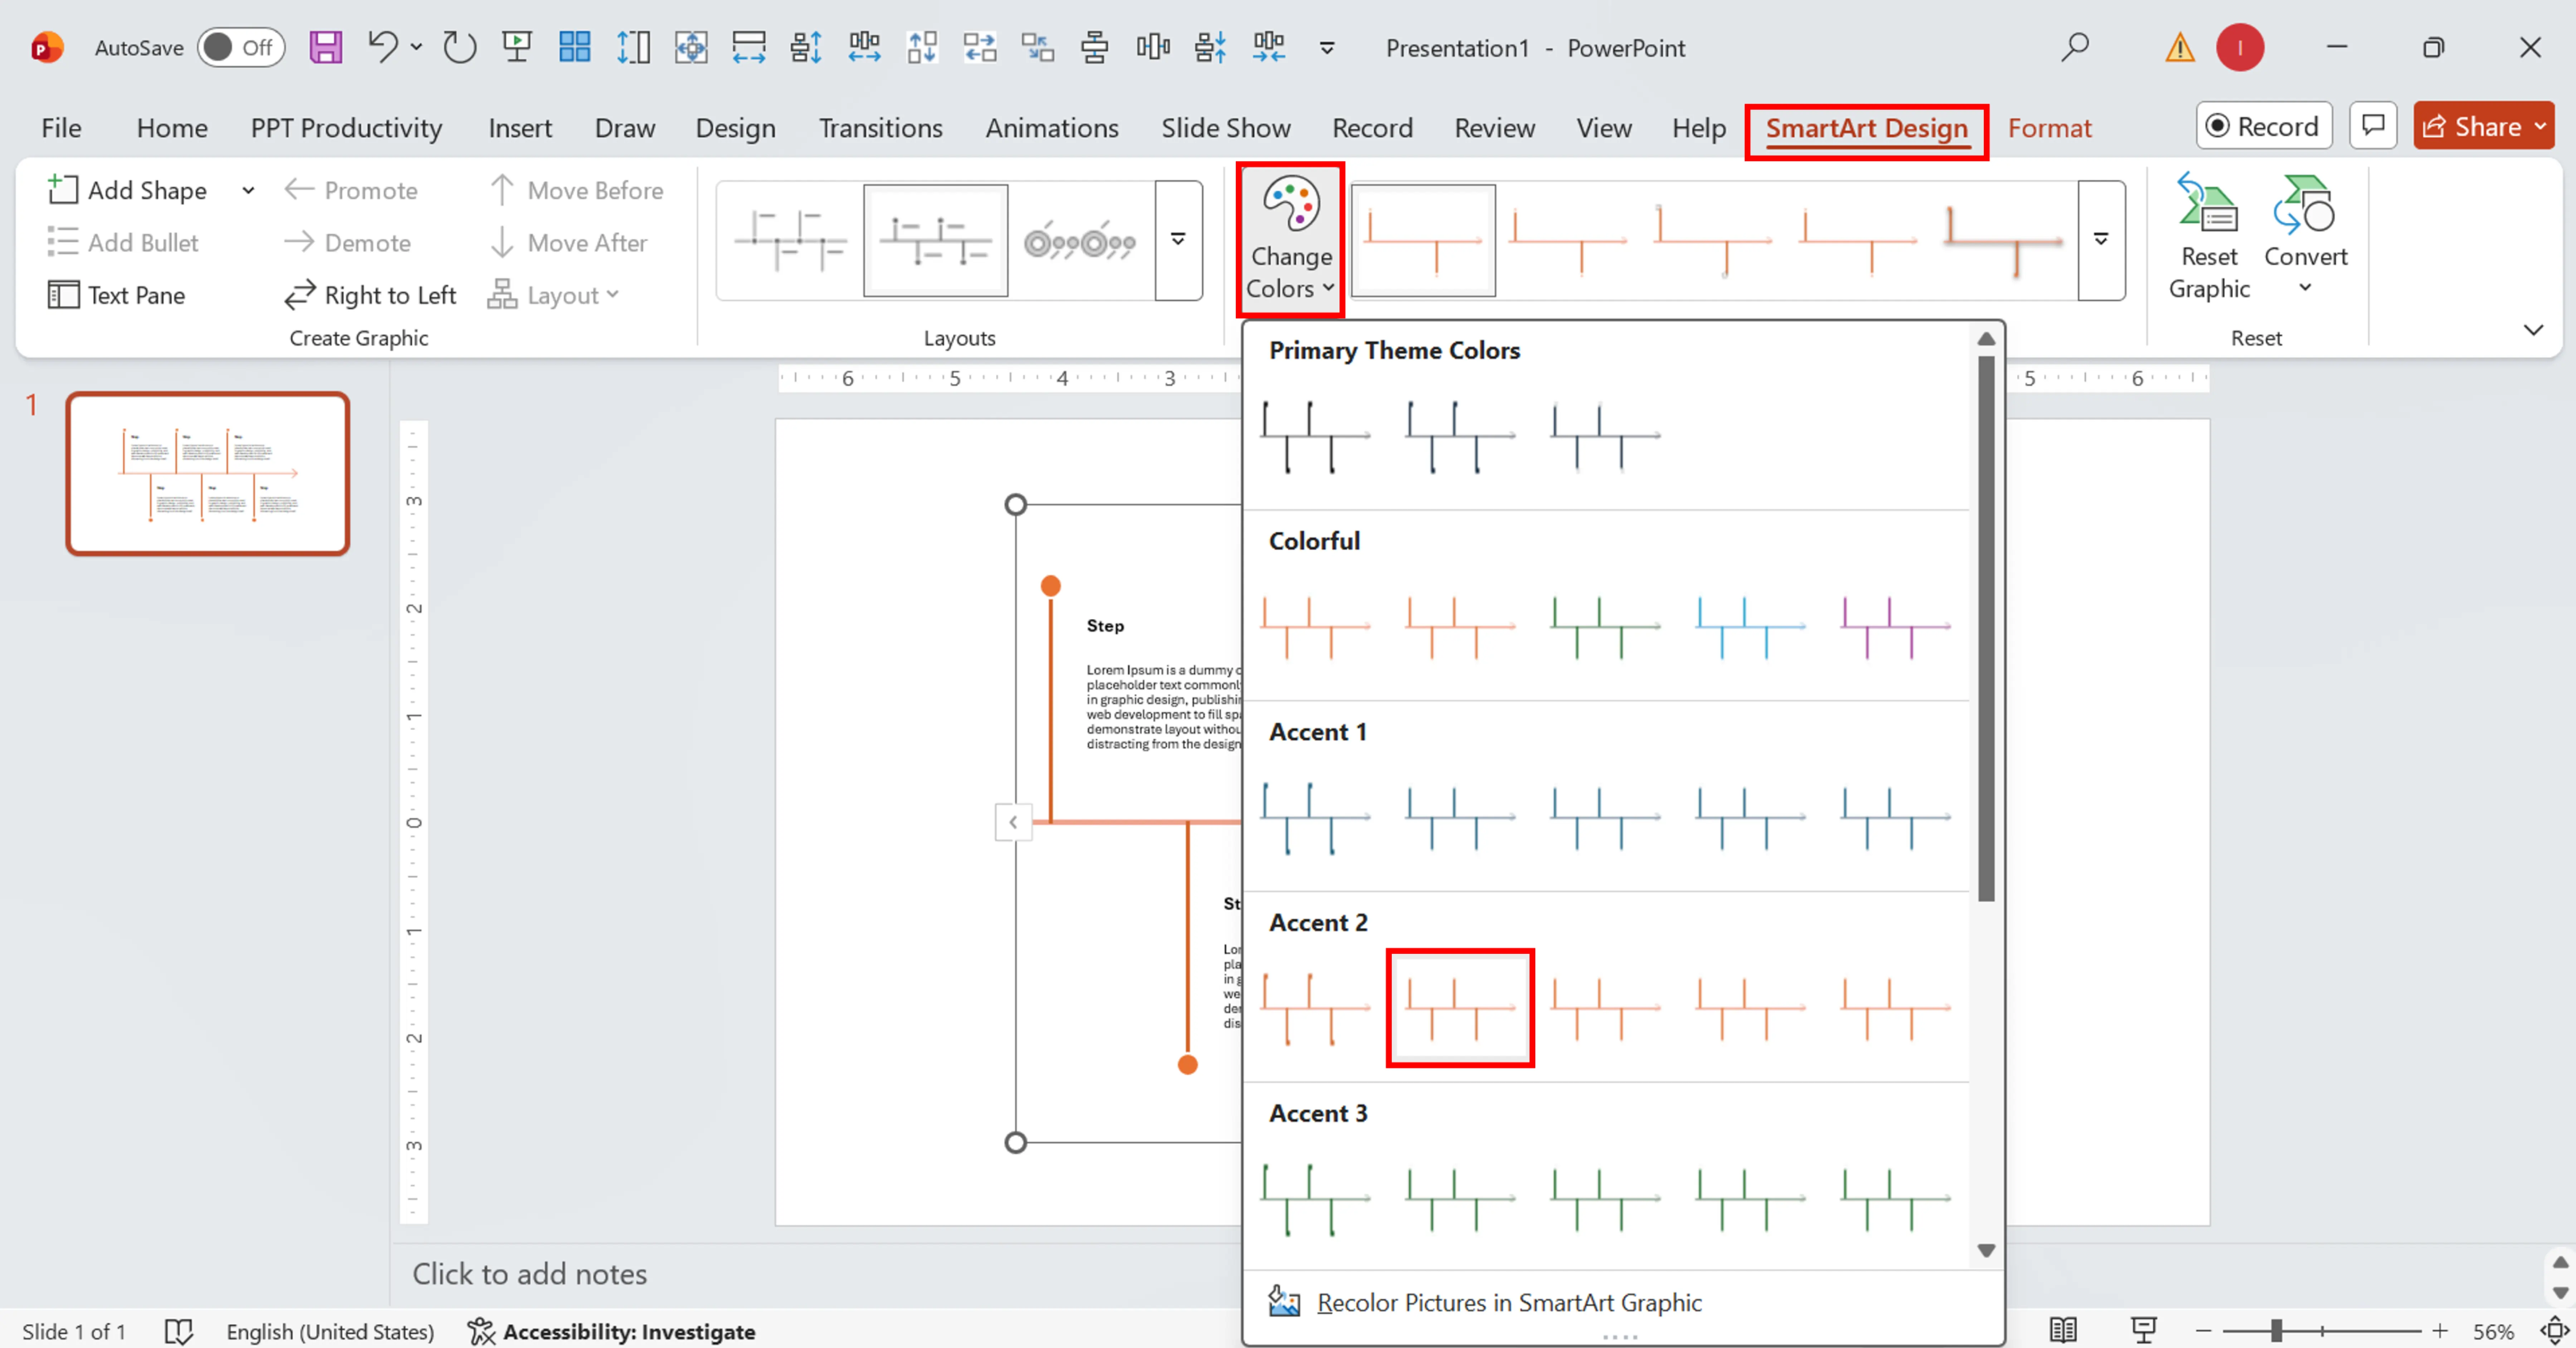
Now you should switch to the SmartArt Design tab. There, you can modify the design with the help of different tools: try Change Colors if you want an accent theme applied to your SmartArt graphic. To change the style of an individual box, switch to the Format tab.
Be careful to make the font sizes the same across all items. The best range would be 14-16pt on a 16:9 slide deck.
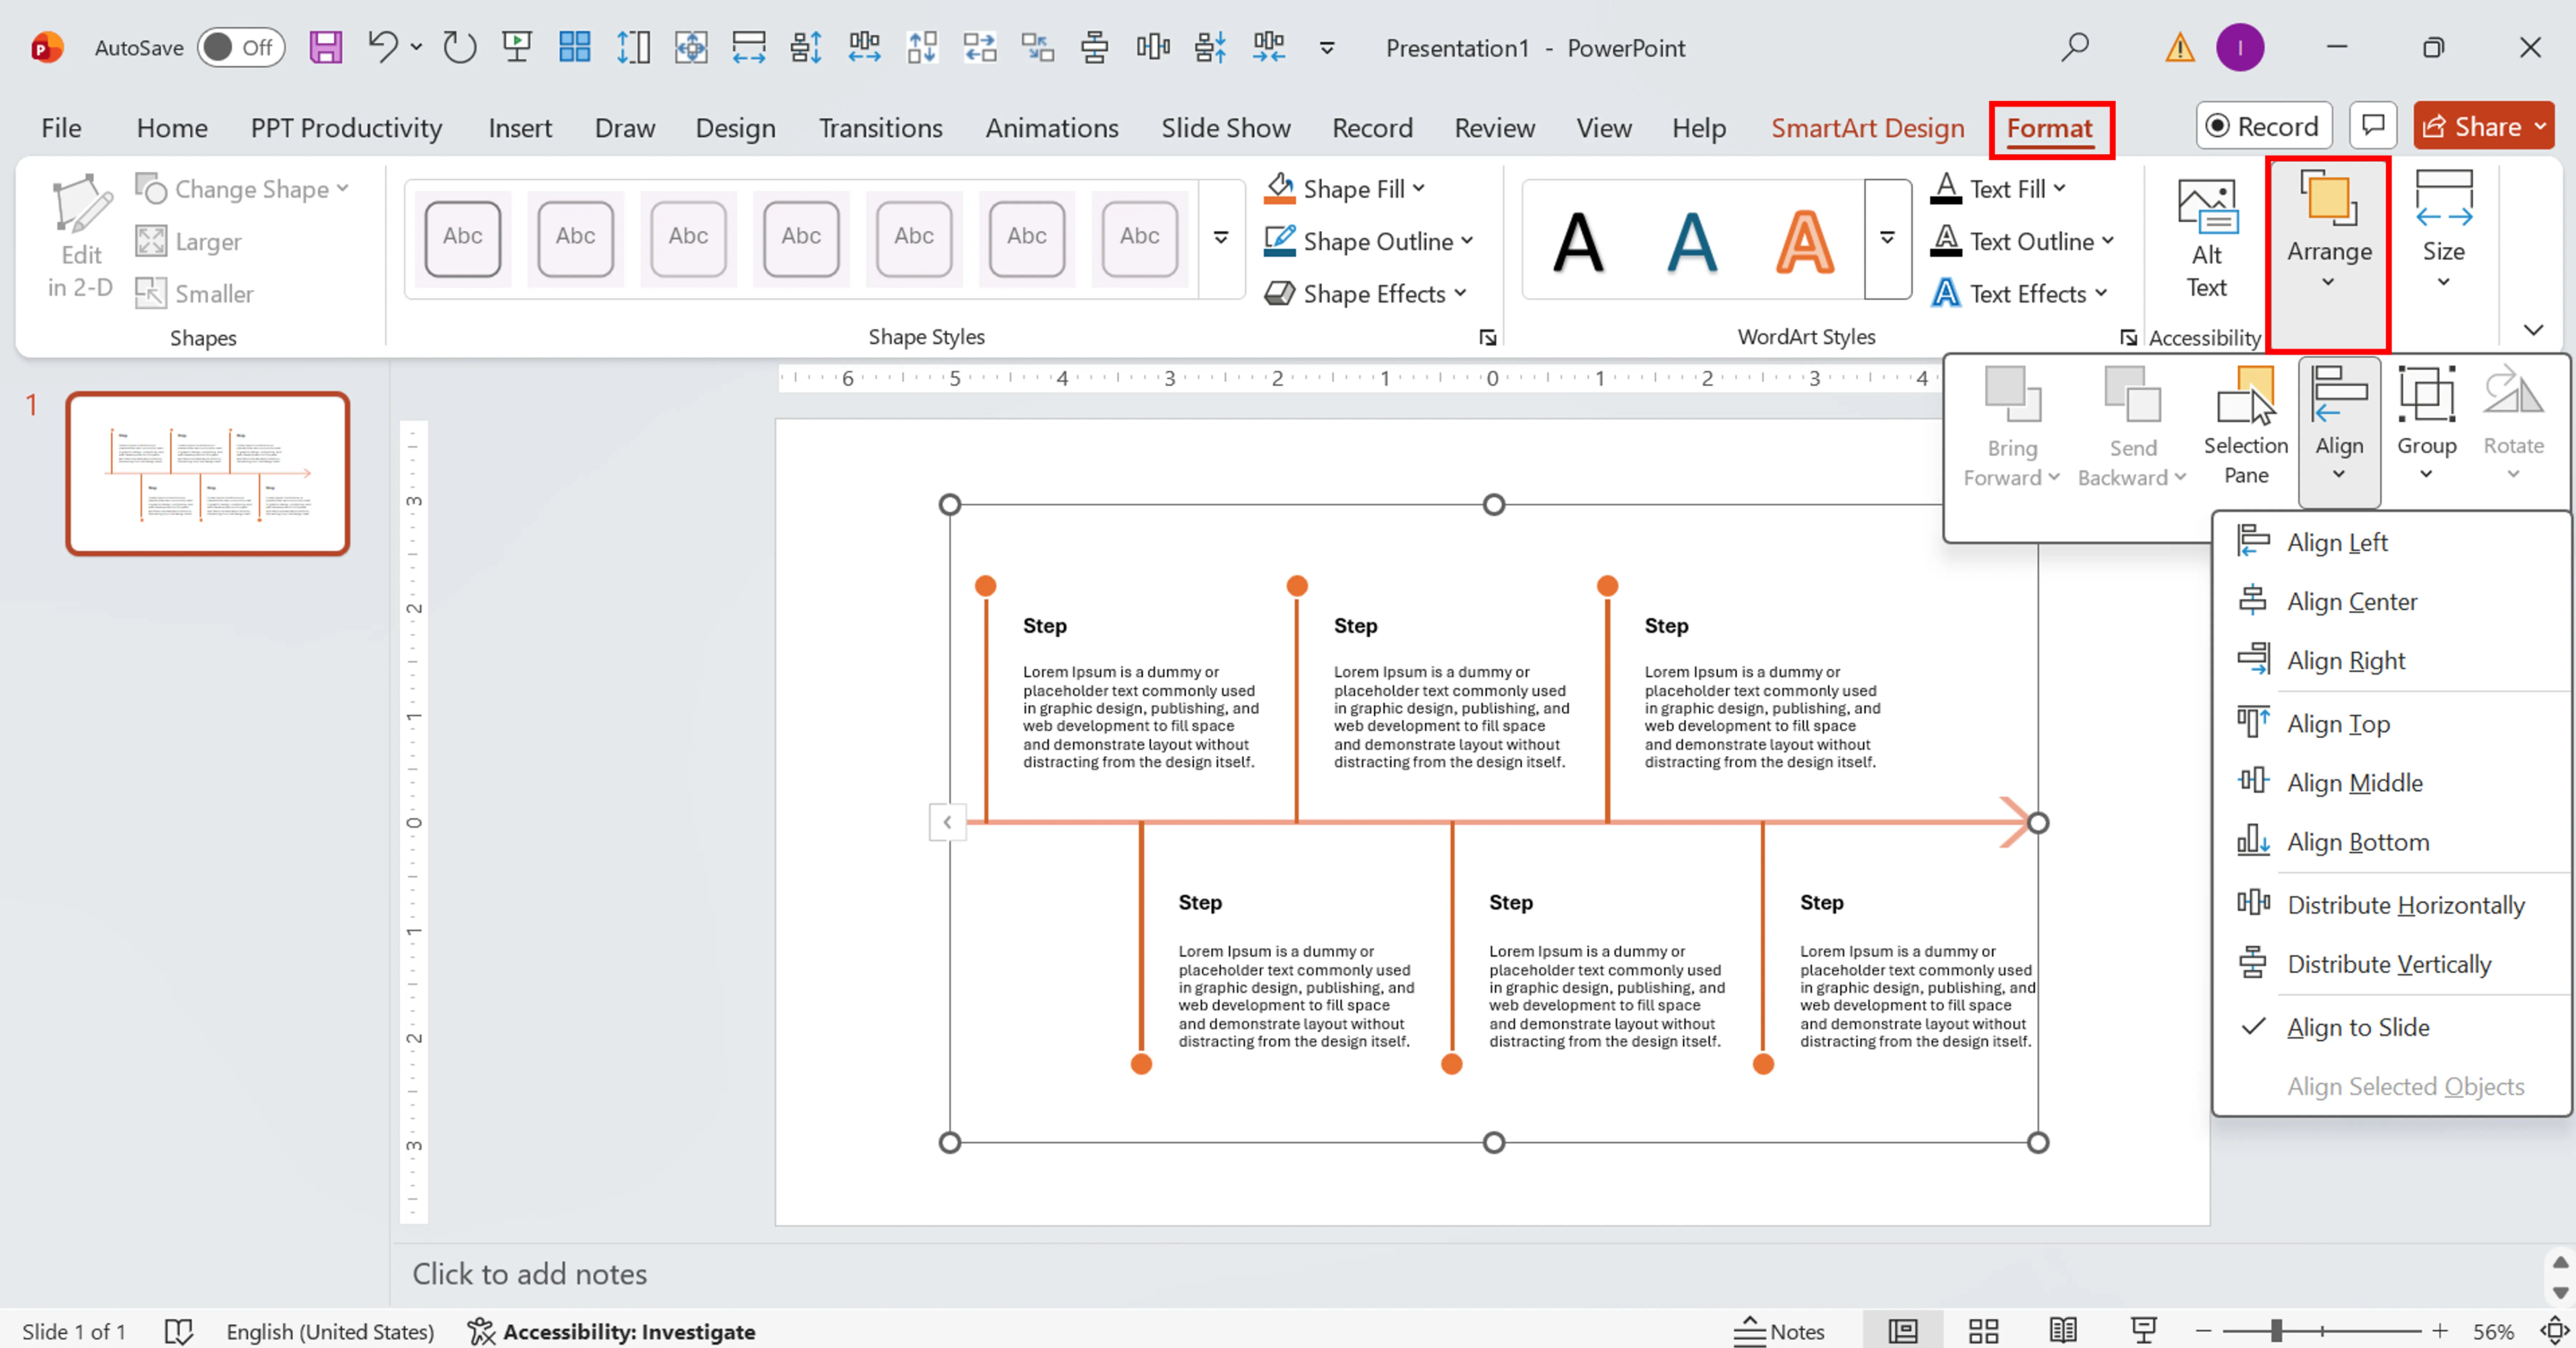
Select the whole diagram using the bounding lines, drag a corner of it while holding Shift to keep aspect ratio constant, and position it correctly on the slide using the Align tools within the Format tab.
Try to give your graphic some space by leaving at least 0.5-inch margins around its edges.
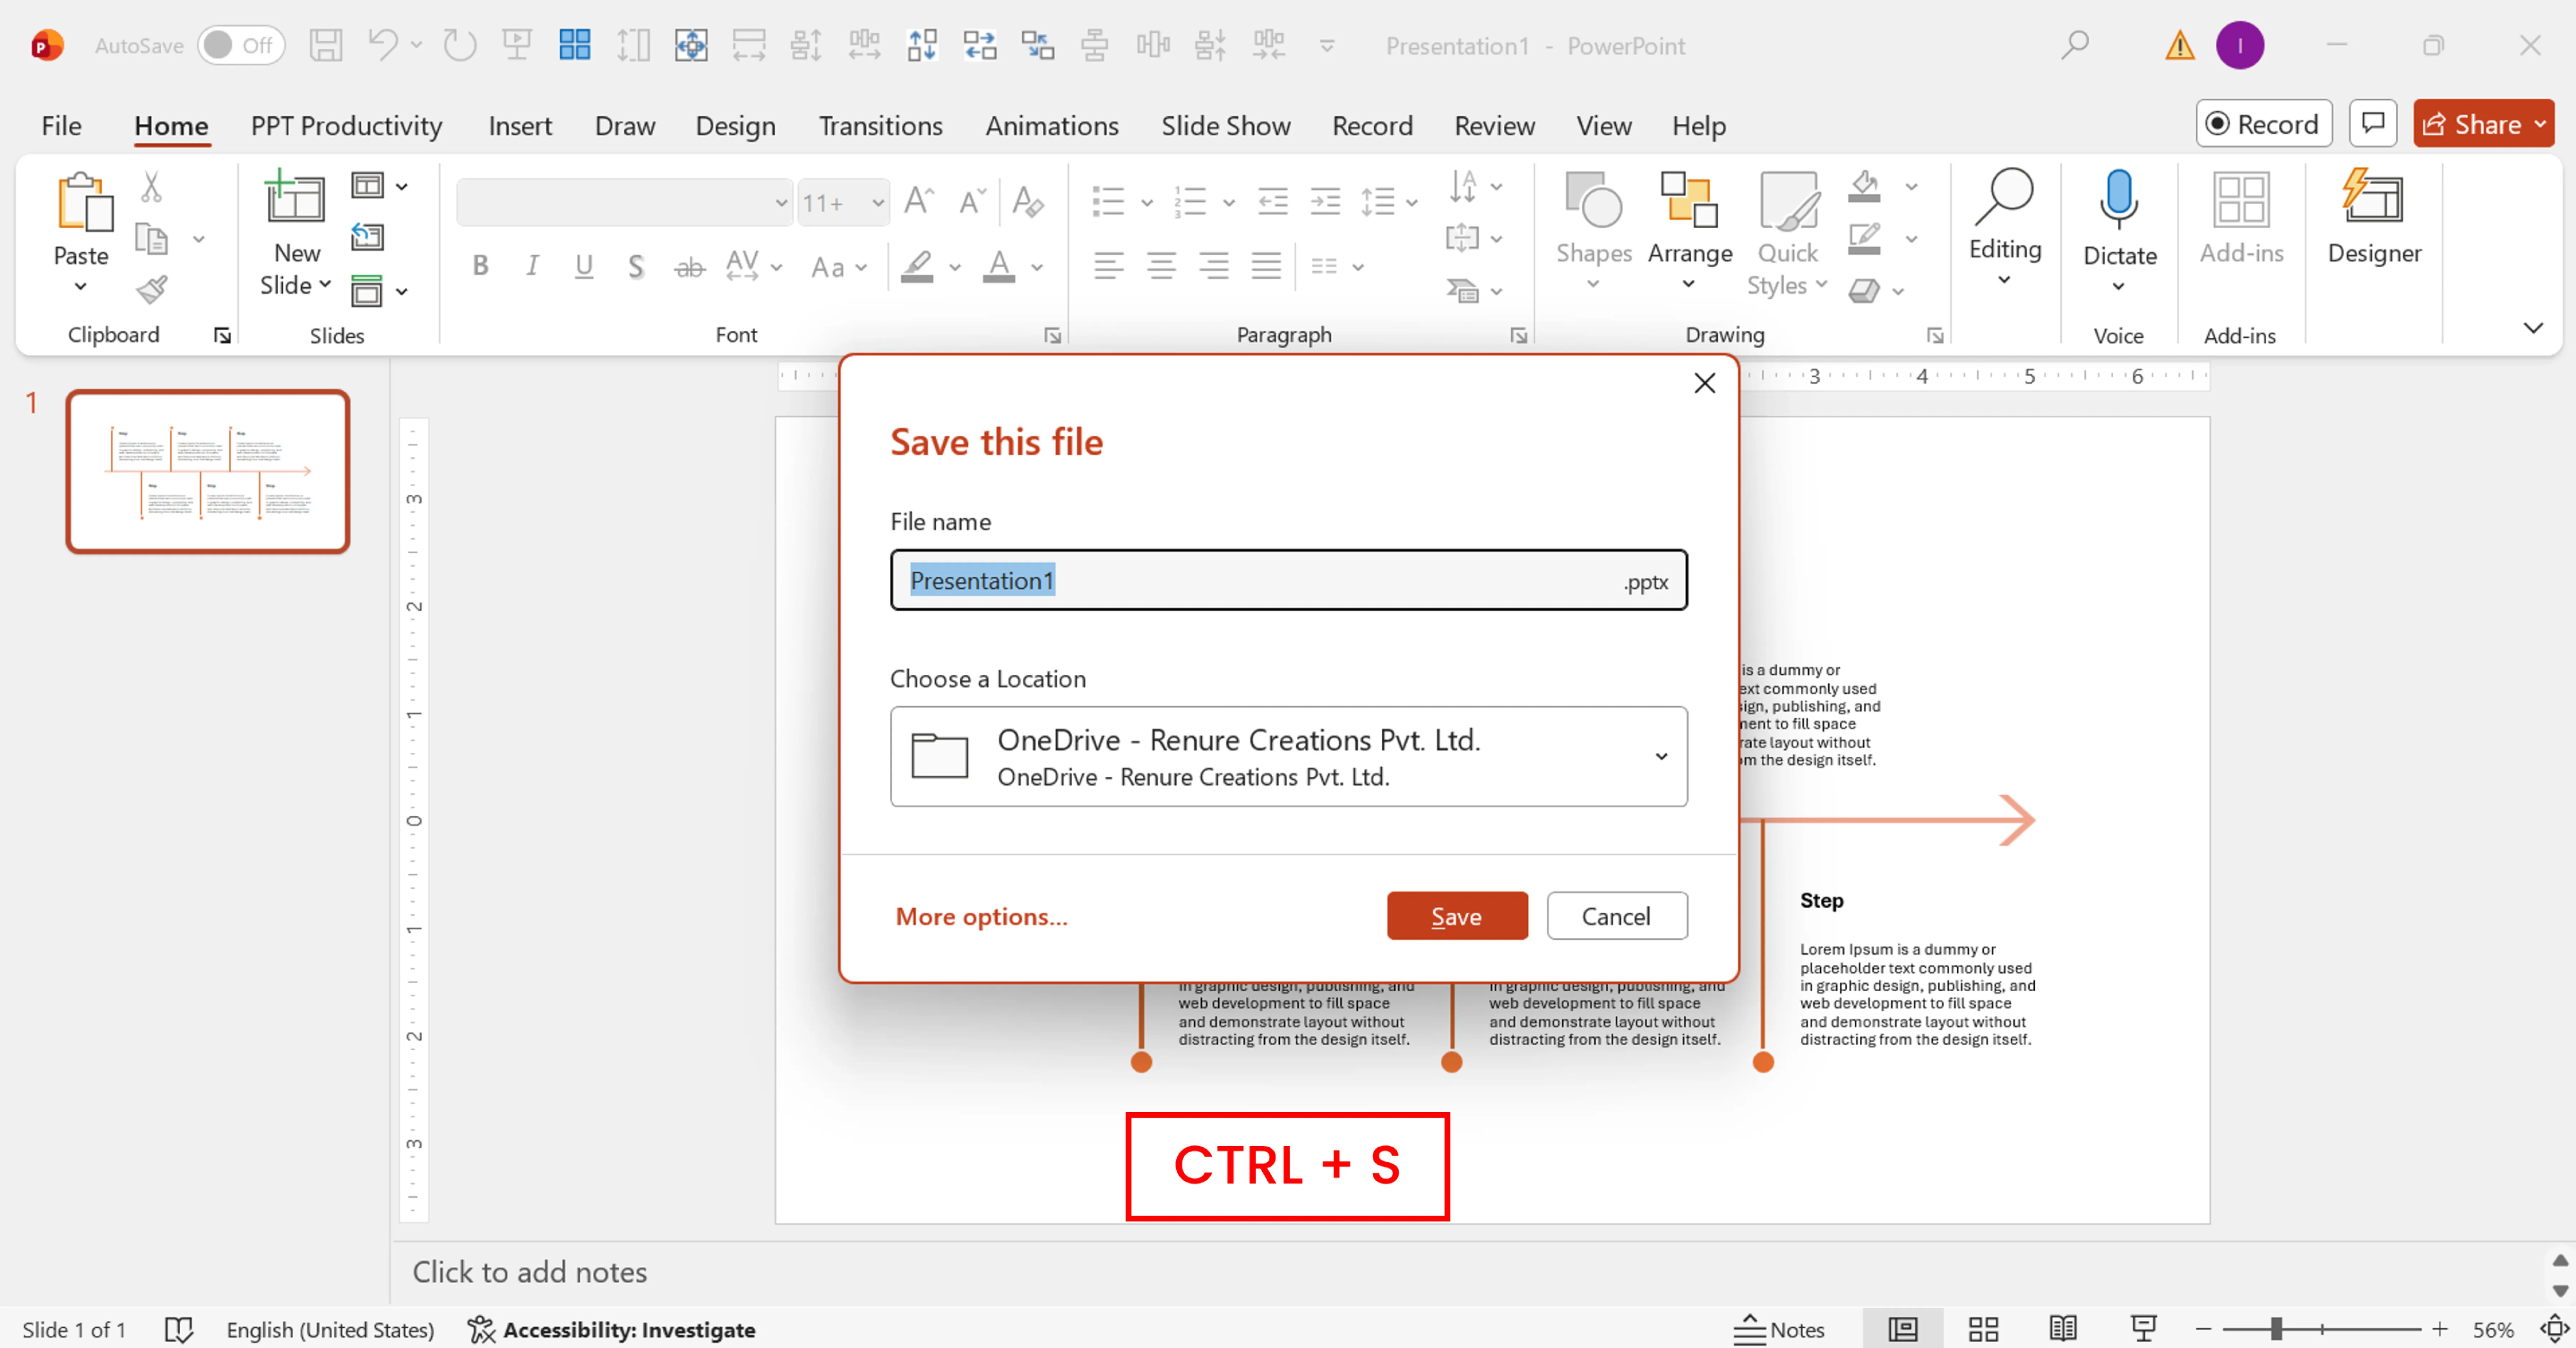
Hit Ctrl + S (Windows) or Cmd + S (Mac). If the document is new, specify its saving location and file format (.pptx).
Method Quick Reference: Insert > SmartArt > Process > Bullet Timeline Inverted > Add Steps > Format > Save
Sometimes you may want to create flowchart PPT by looping. Unfortunately, there is no way to achieve that with SmartArt graphics. You will have to build a process diagram from shapes manually.
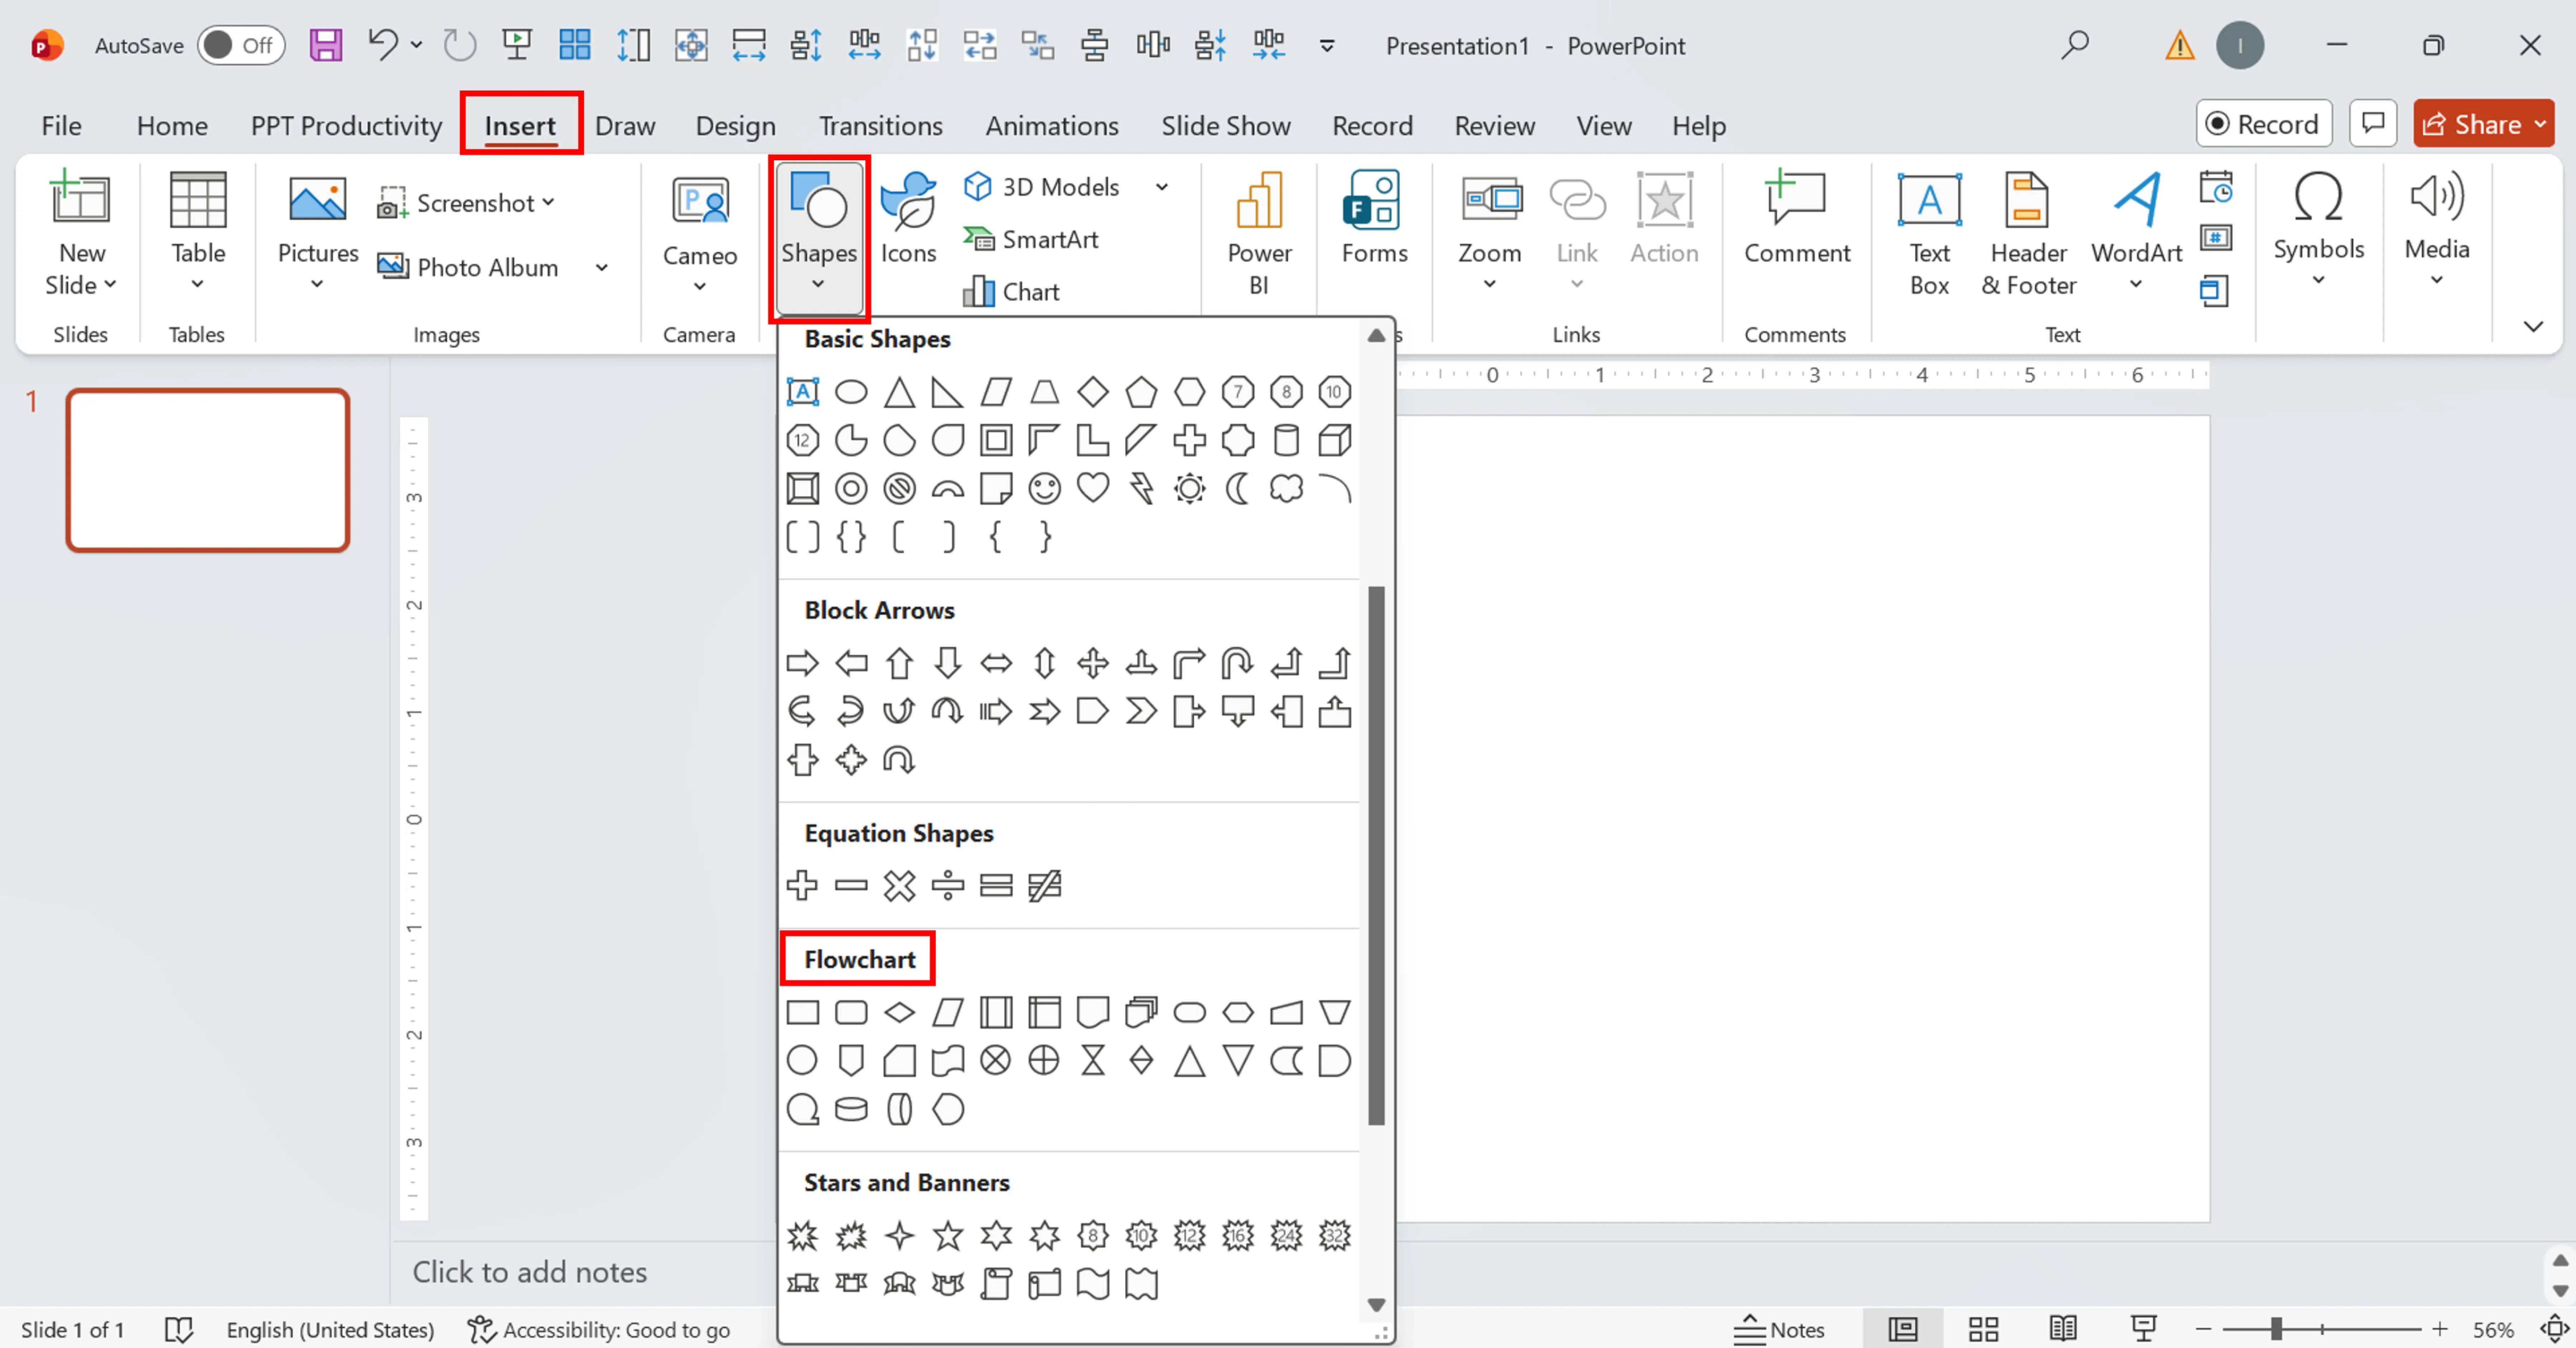
Switch to the Insert tab and click on the Shapes option. Within the Shapes menu, you will find all basic diagram elements that you might need. The ones you'll use the most are:
Click on one of the shapes and draw it in your slide. Hold Shift while drawing the element to maintain aspect ratio.

Just double-click on any element and start typing. Then, hit Escape. Increase font weight to bold if you plan to write a short action such as Start or End.
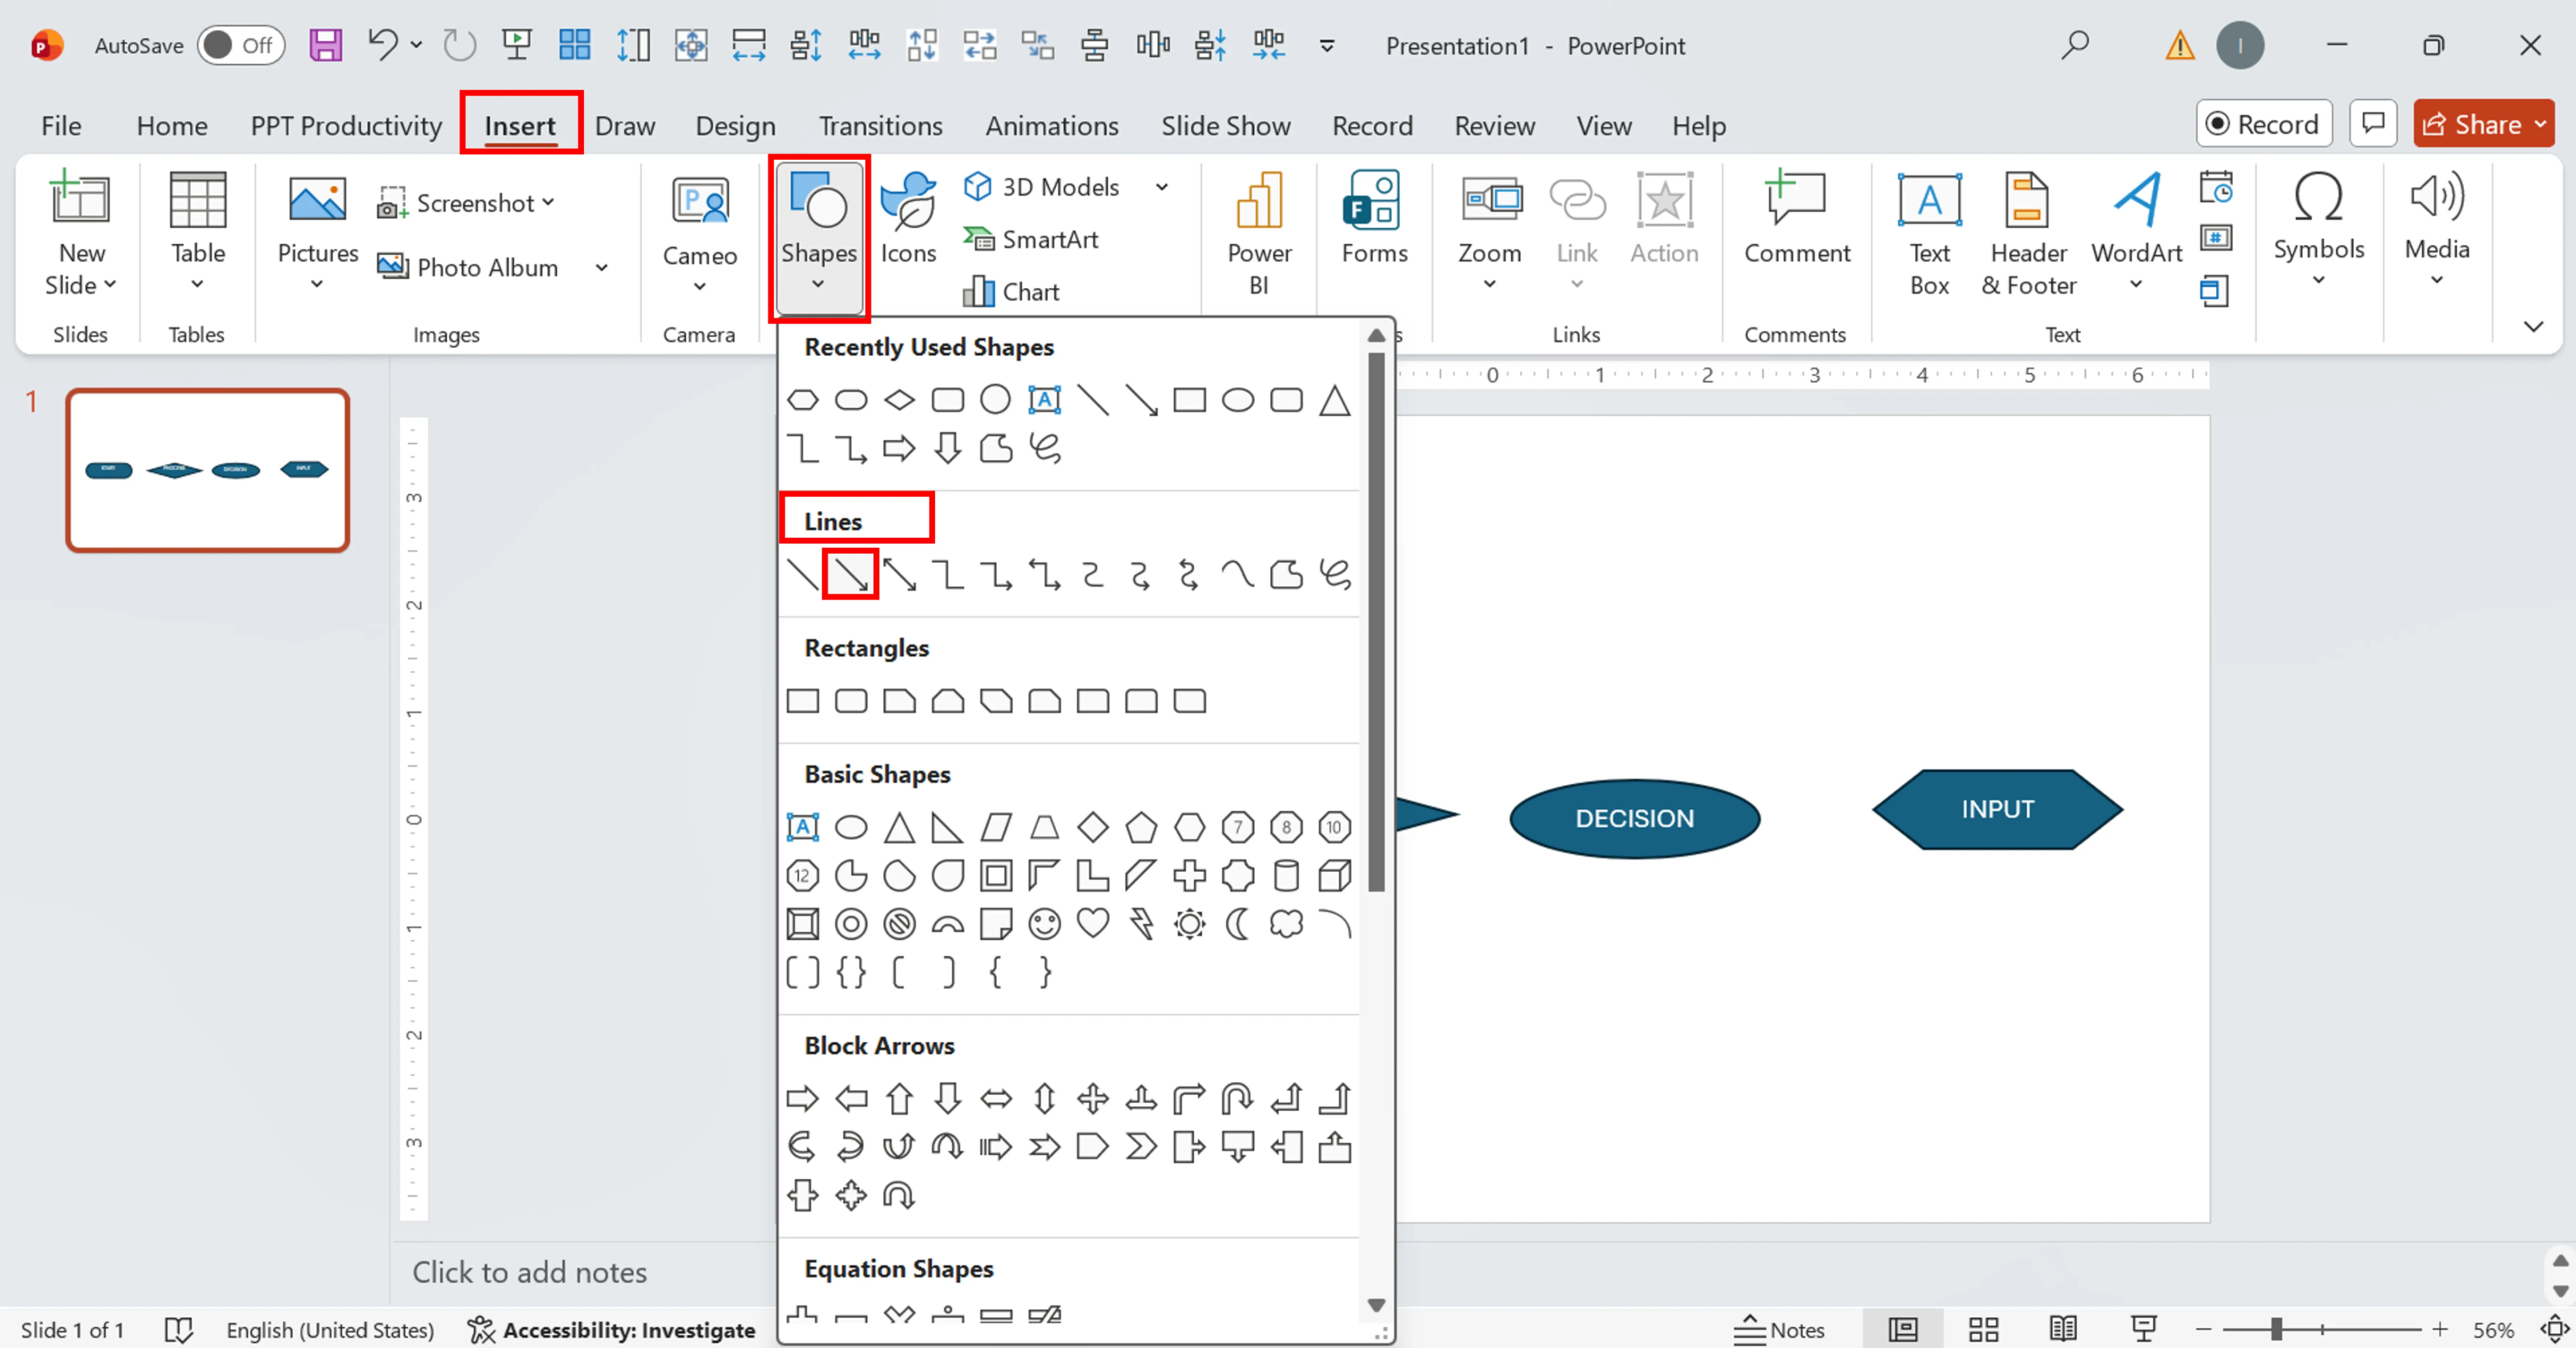
Now it's time to connect your actions with arrow connectors. Navigate back to the Insert tab, select an arrow connector, and hover over the source shape. Green connection points will appear; just click on one, drag it to the destination, and place it on a corresponding point.
Use the Elbow Arrow Connector for structured flowcharts. Don't forget to type names for Yes and No options.
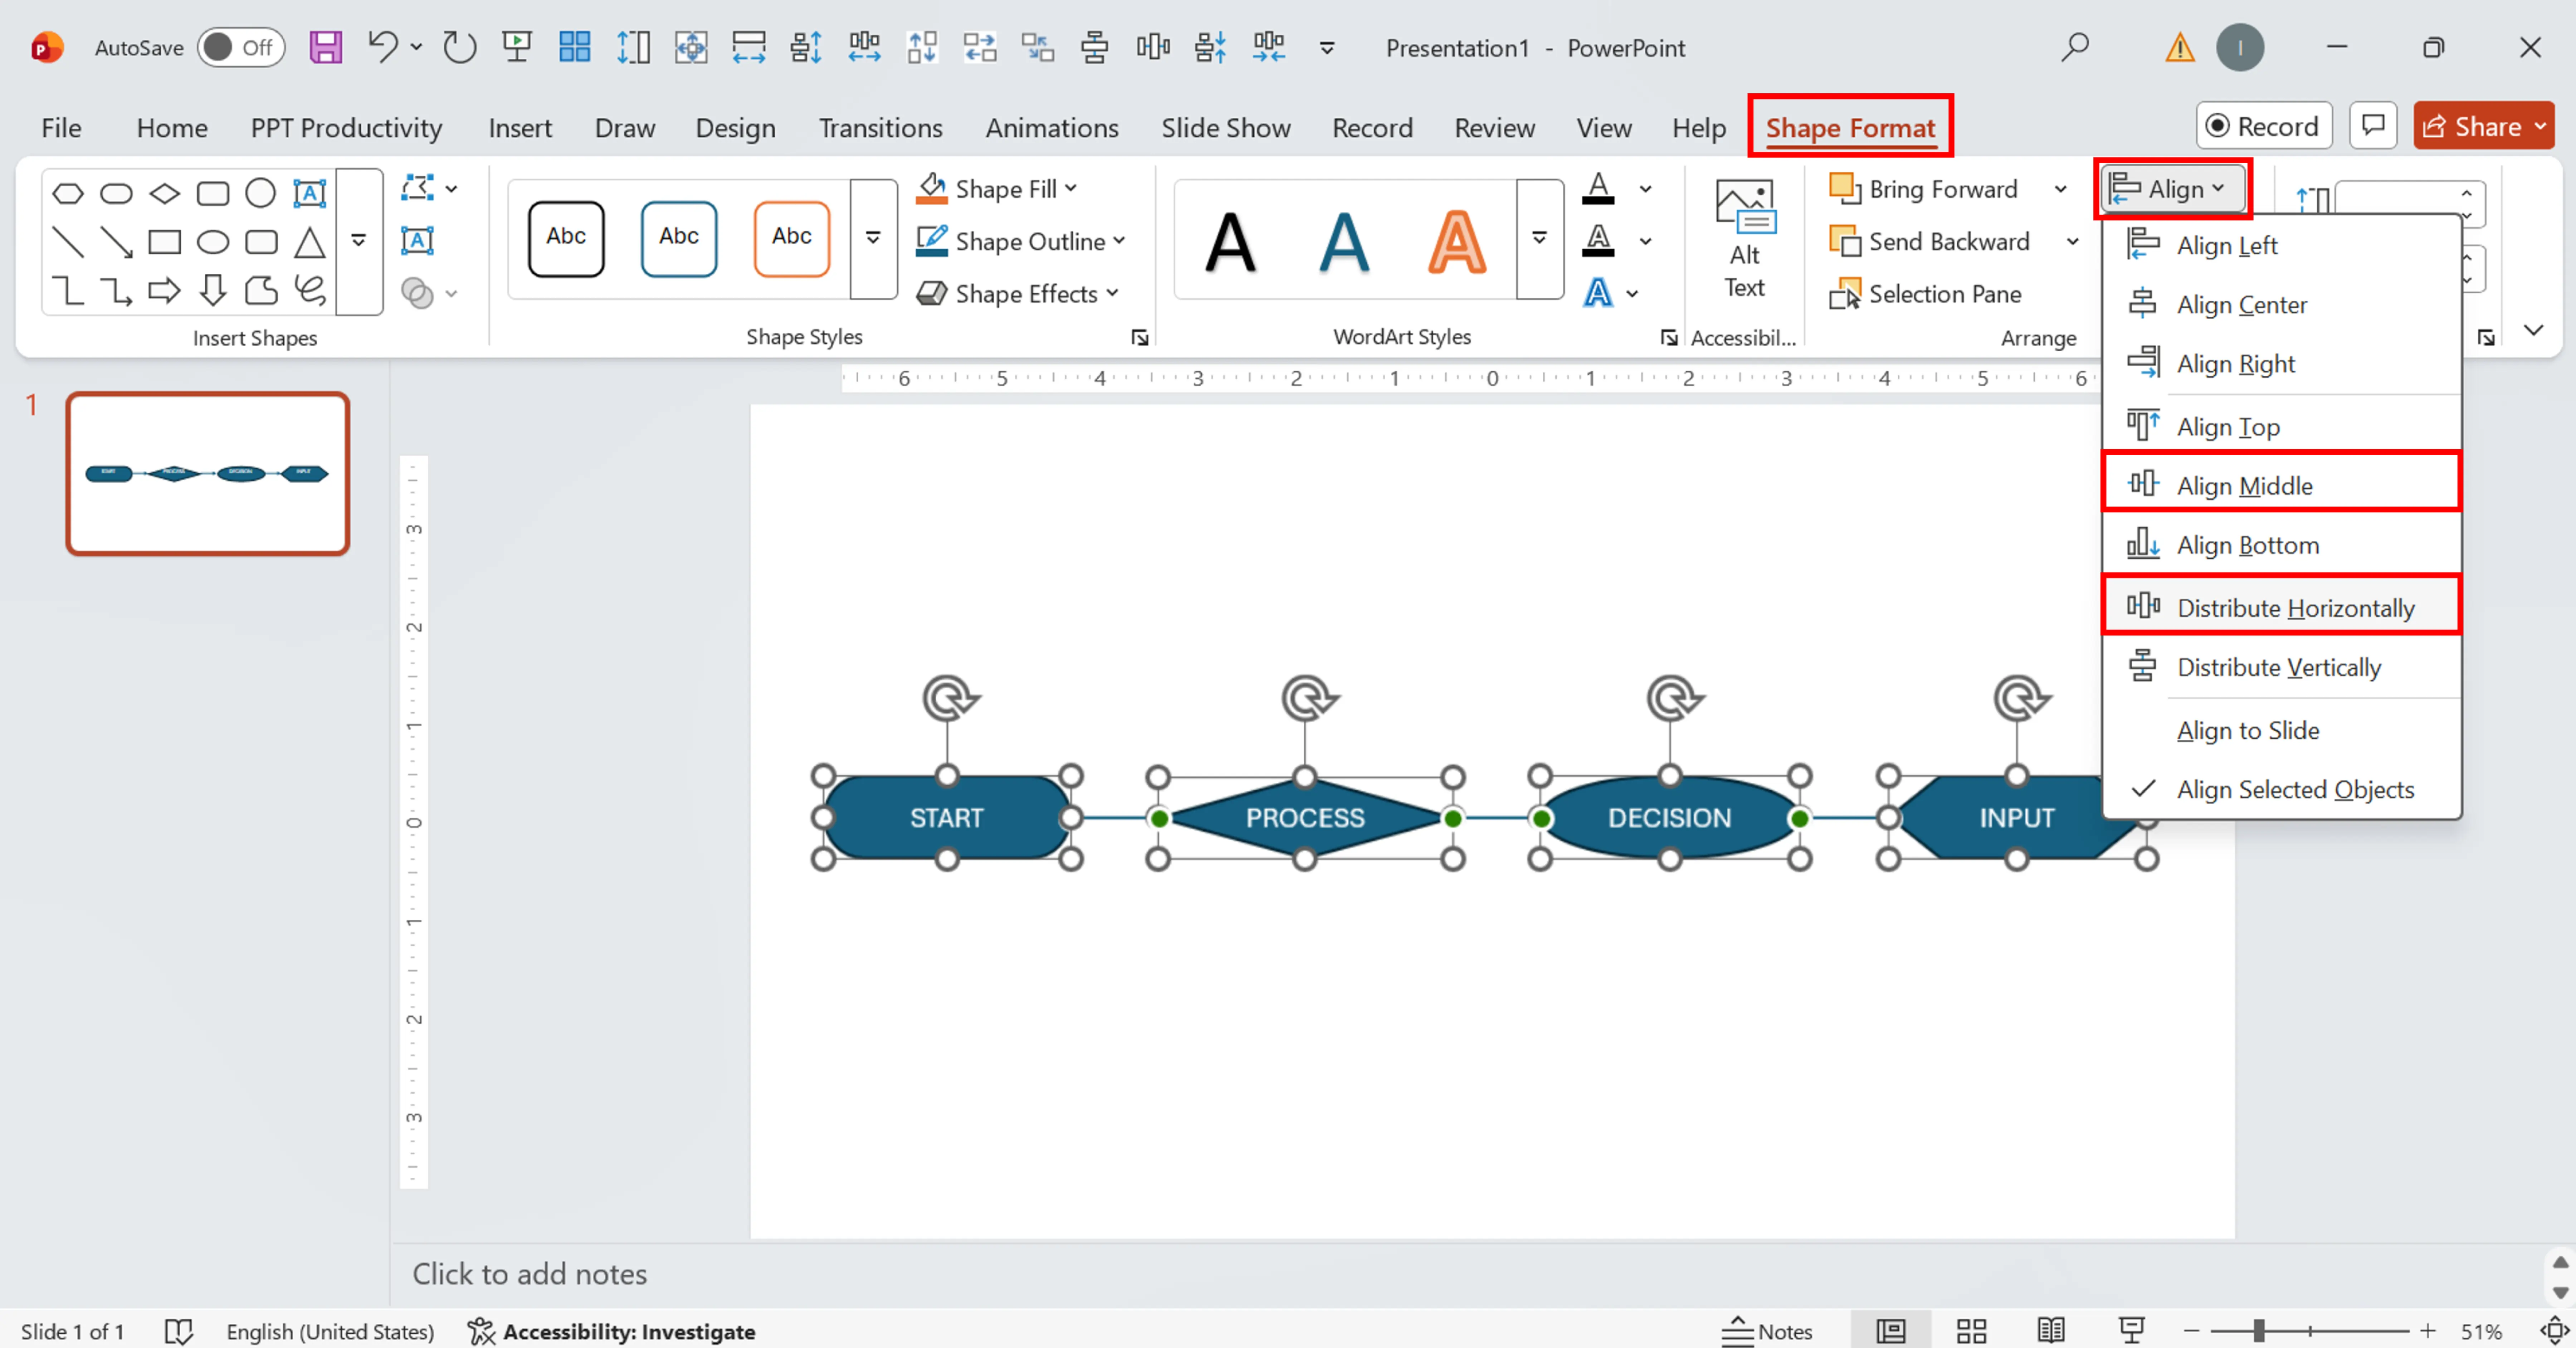
You can either distribute selected items using a simple drag-and-drop approach or do it with the Align tool from Format > Arrange. Choose the Horizontal option.
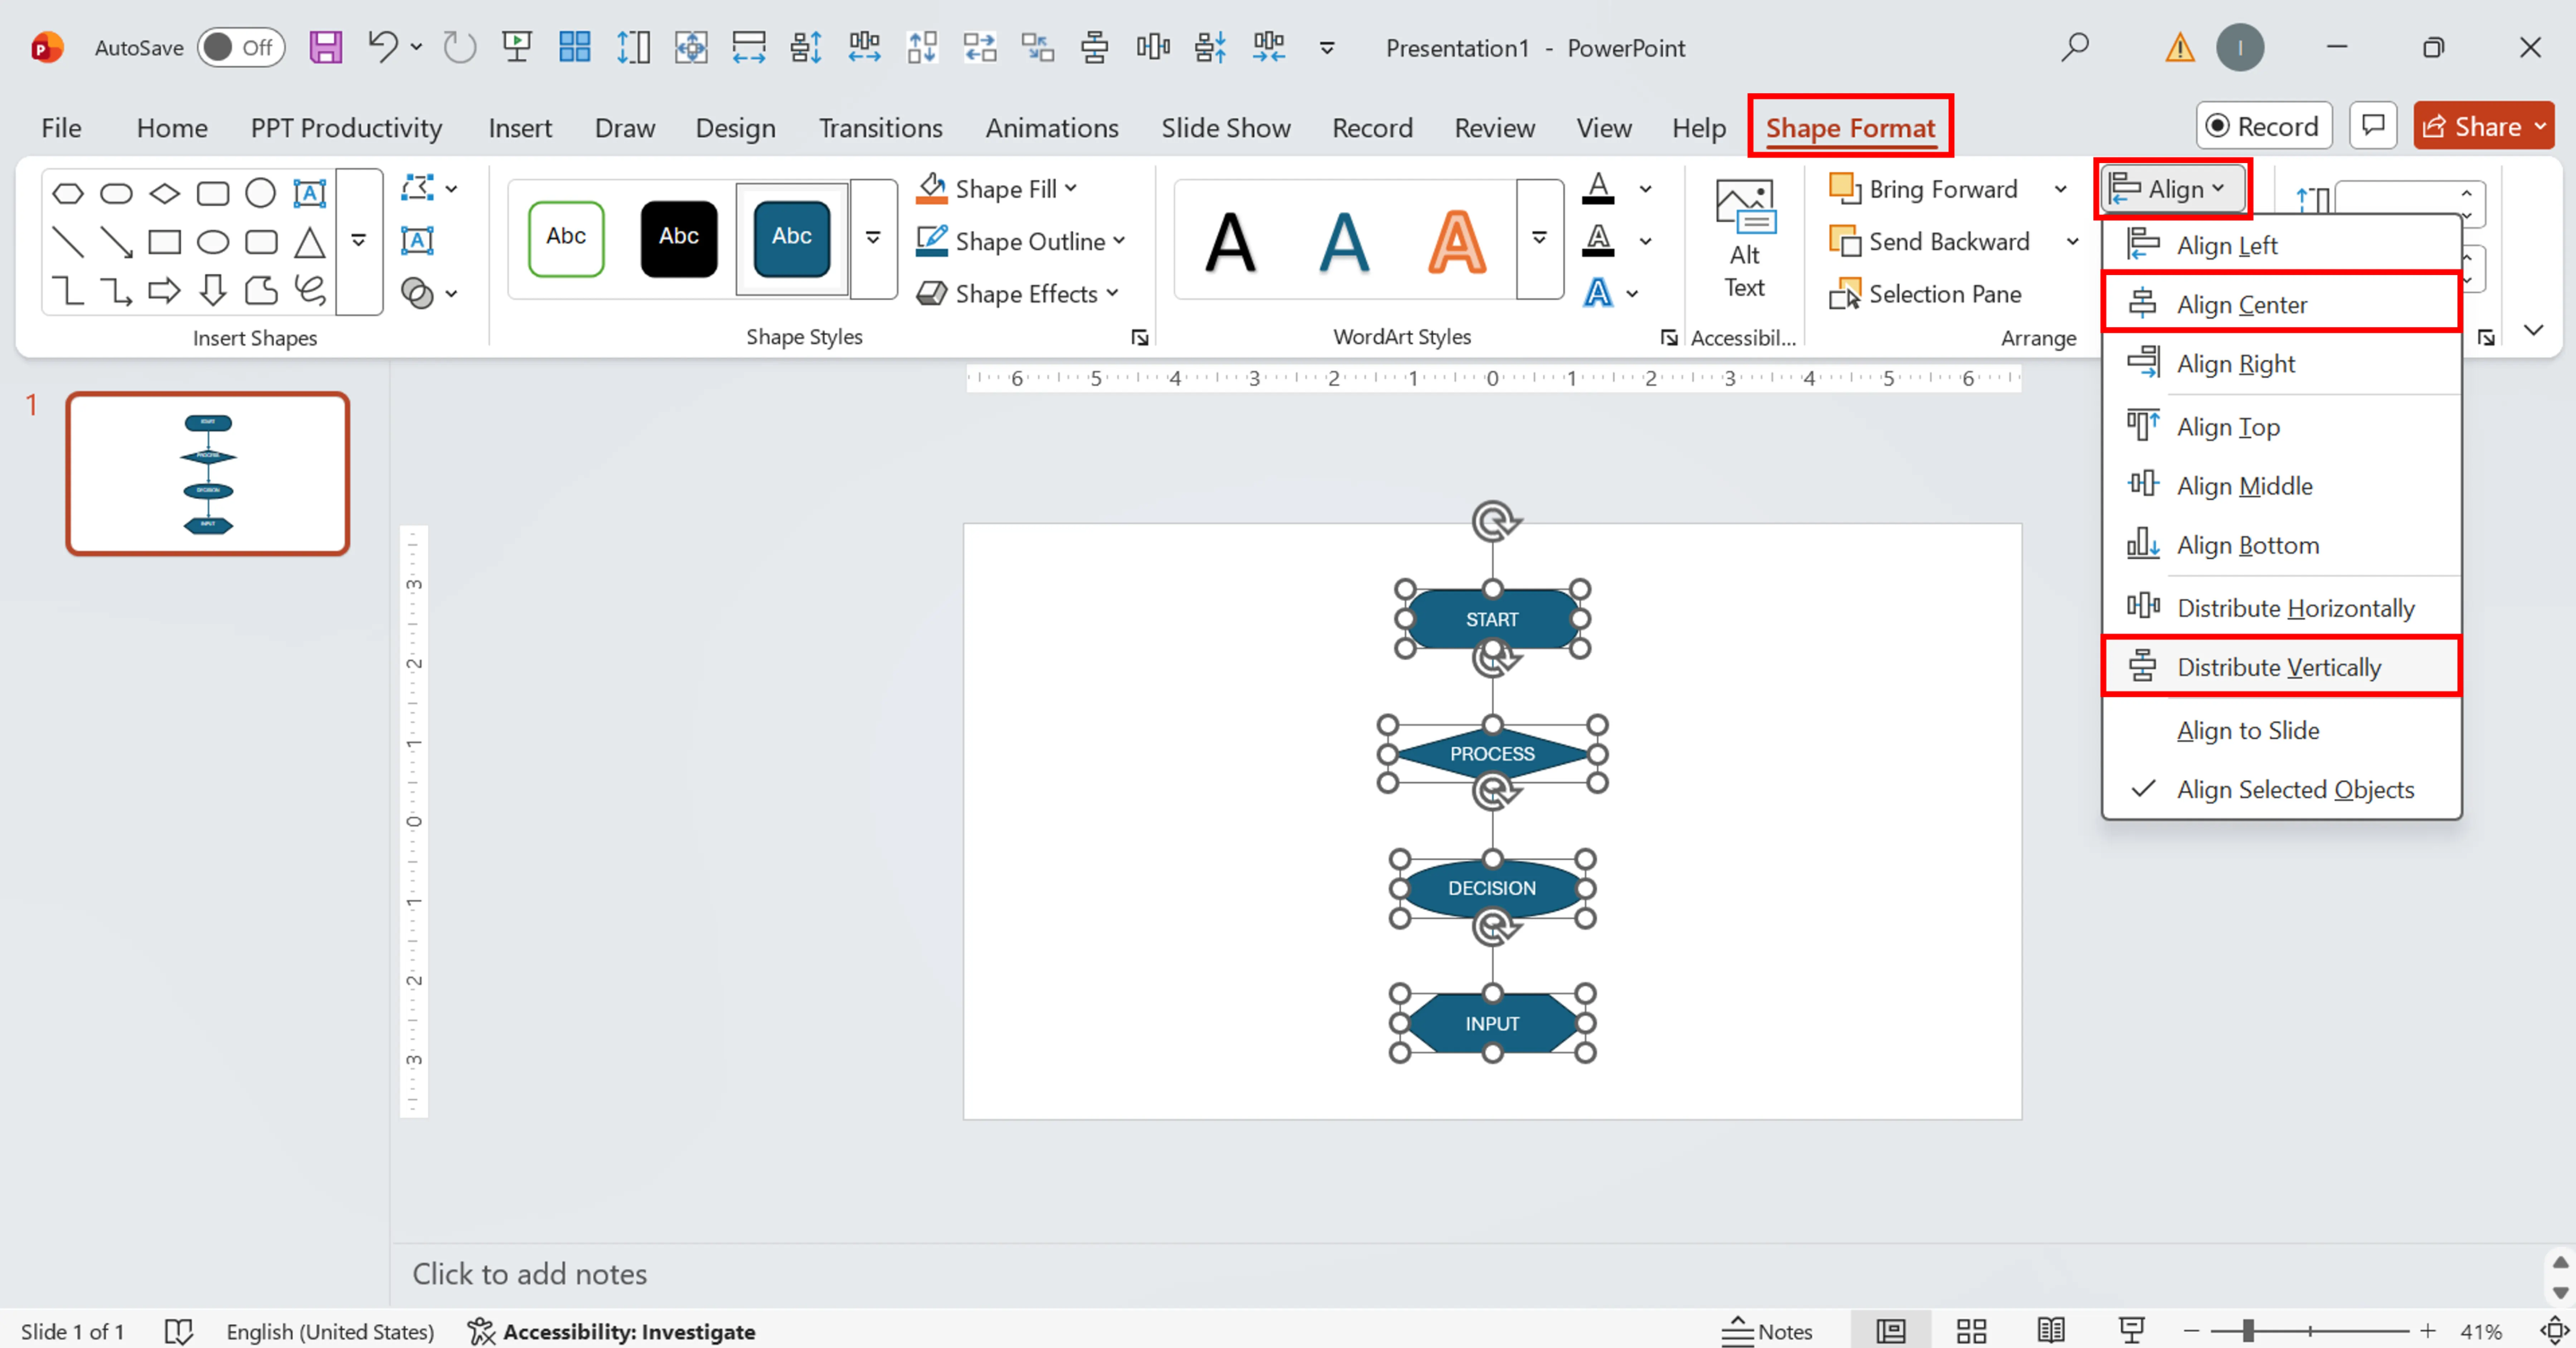
Again, you can do it either manually or with the Align tool. The vertical option is used here.
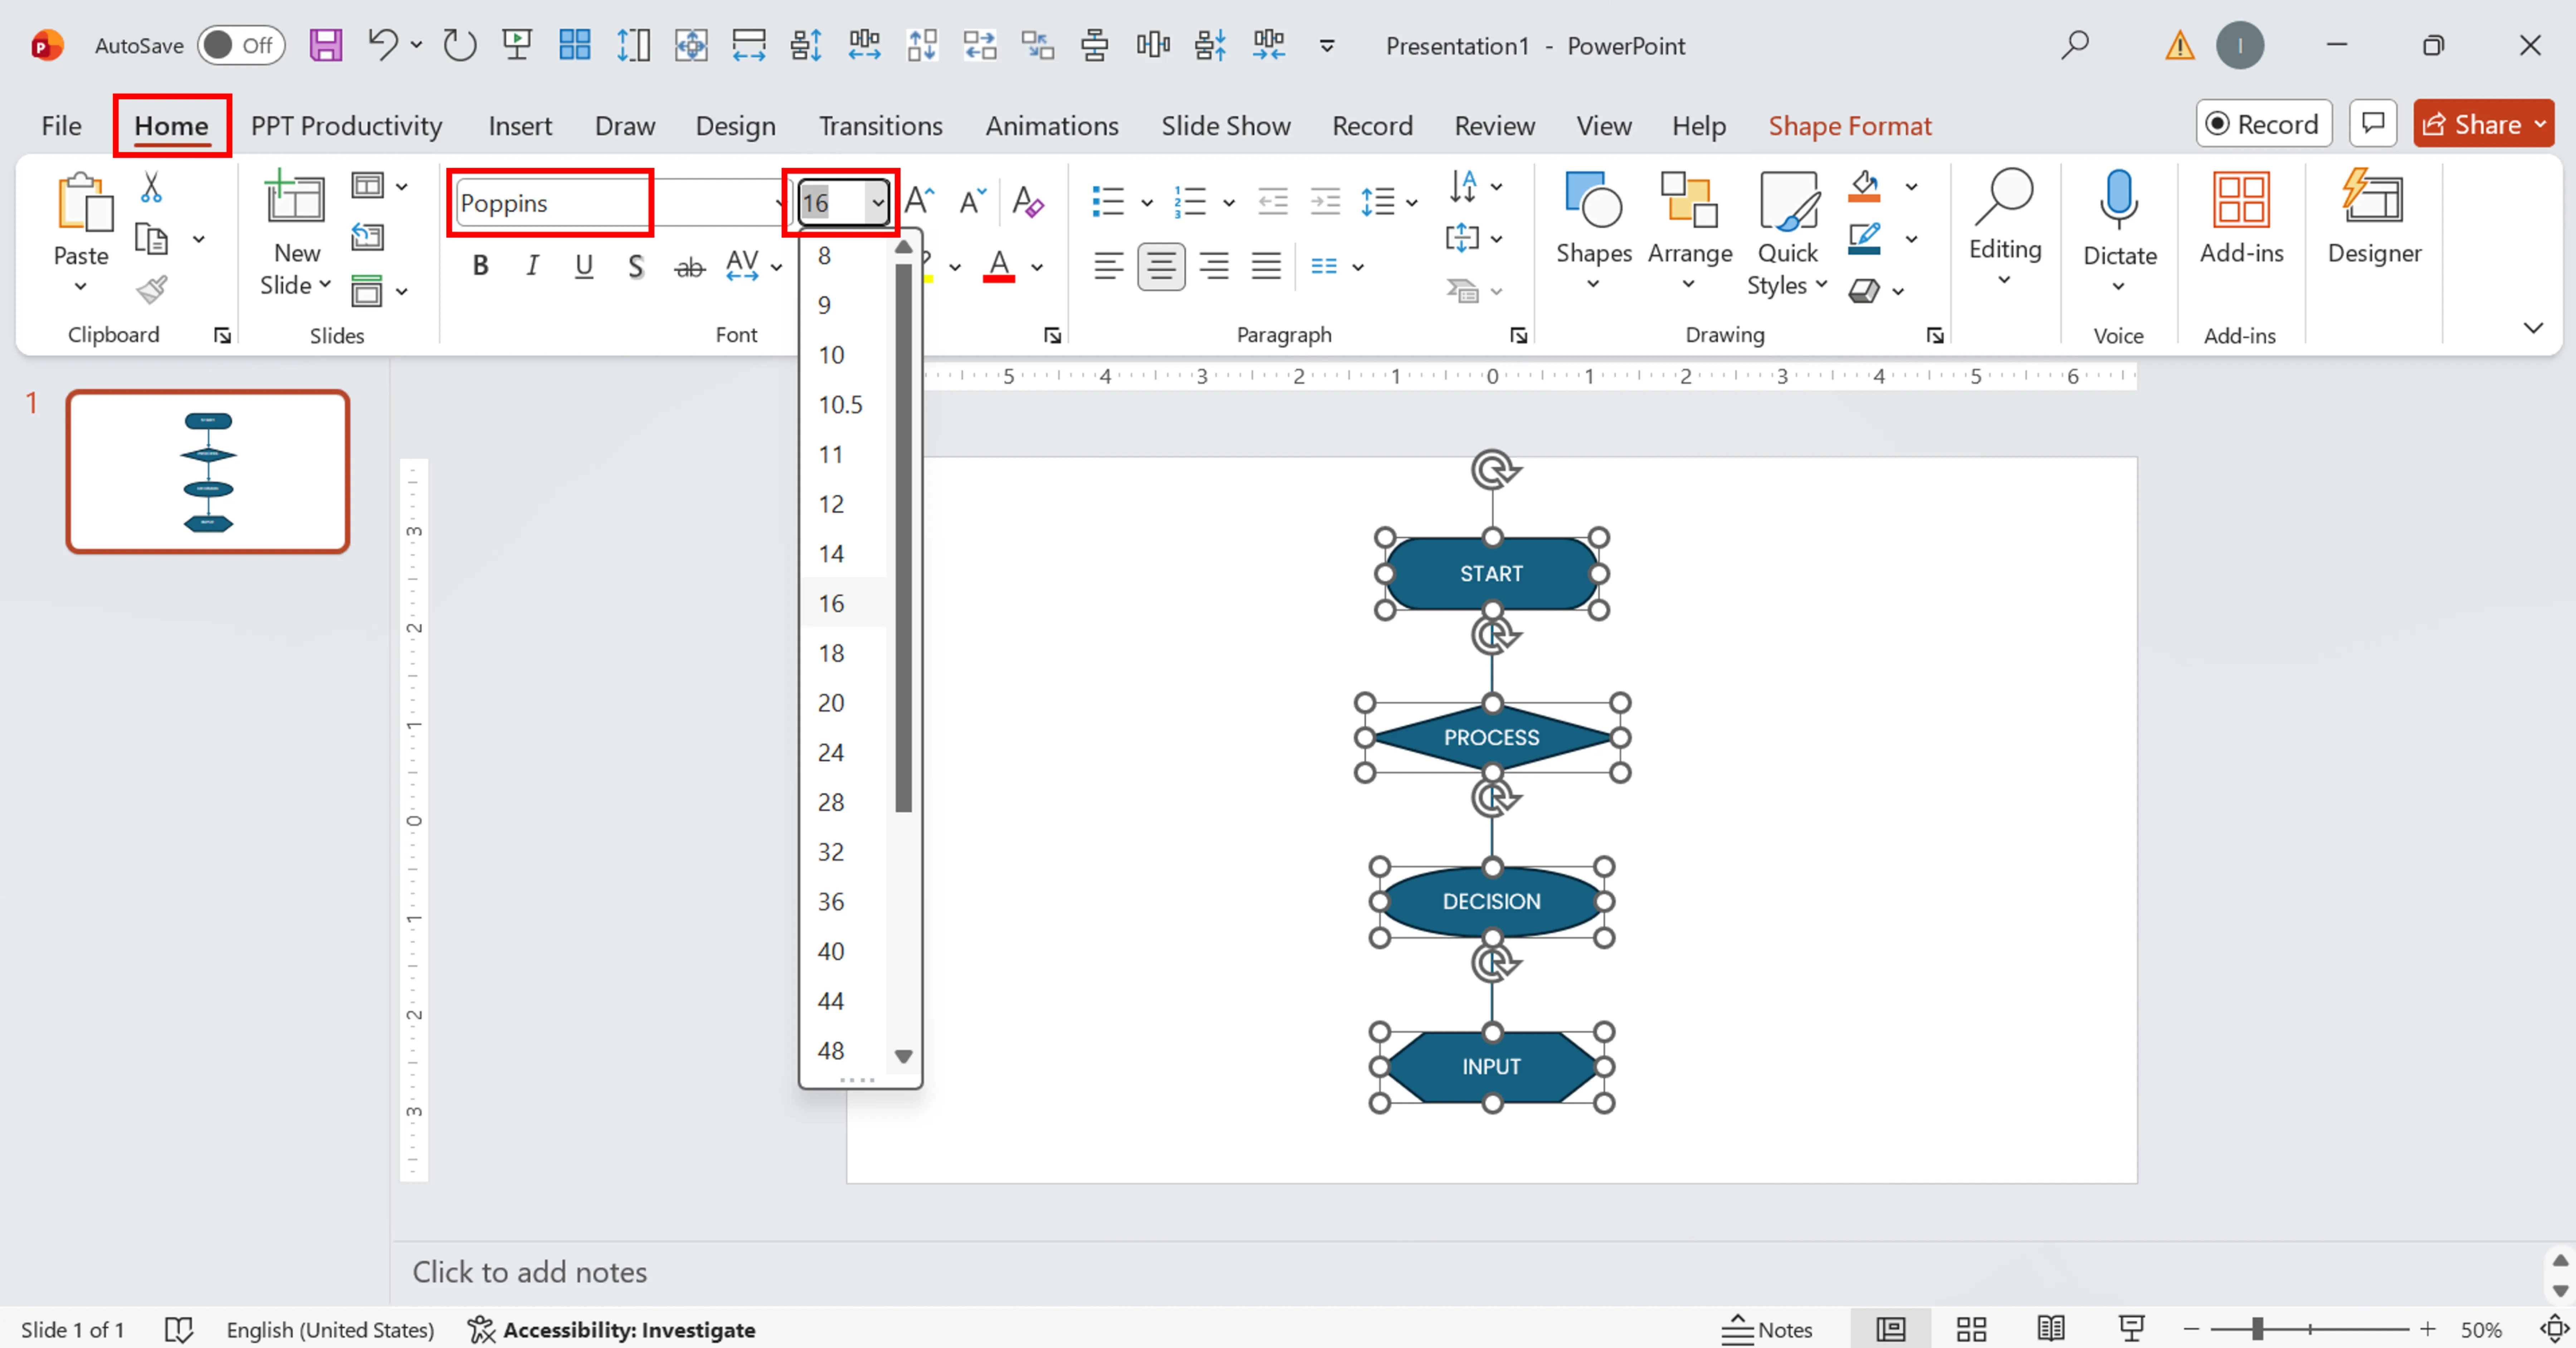
Firstly, select all process-related shapes (hold Ctrl, click on them one by one) and apply the same font and style.
The font size of the step name should be between 14 and 16 points on a 16:9 slide deck.
Then, select all your flowchart components, go to Format > Arrange > Group, and group the diagram. This way, it can be moved and resized as a single object.
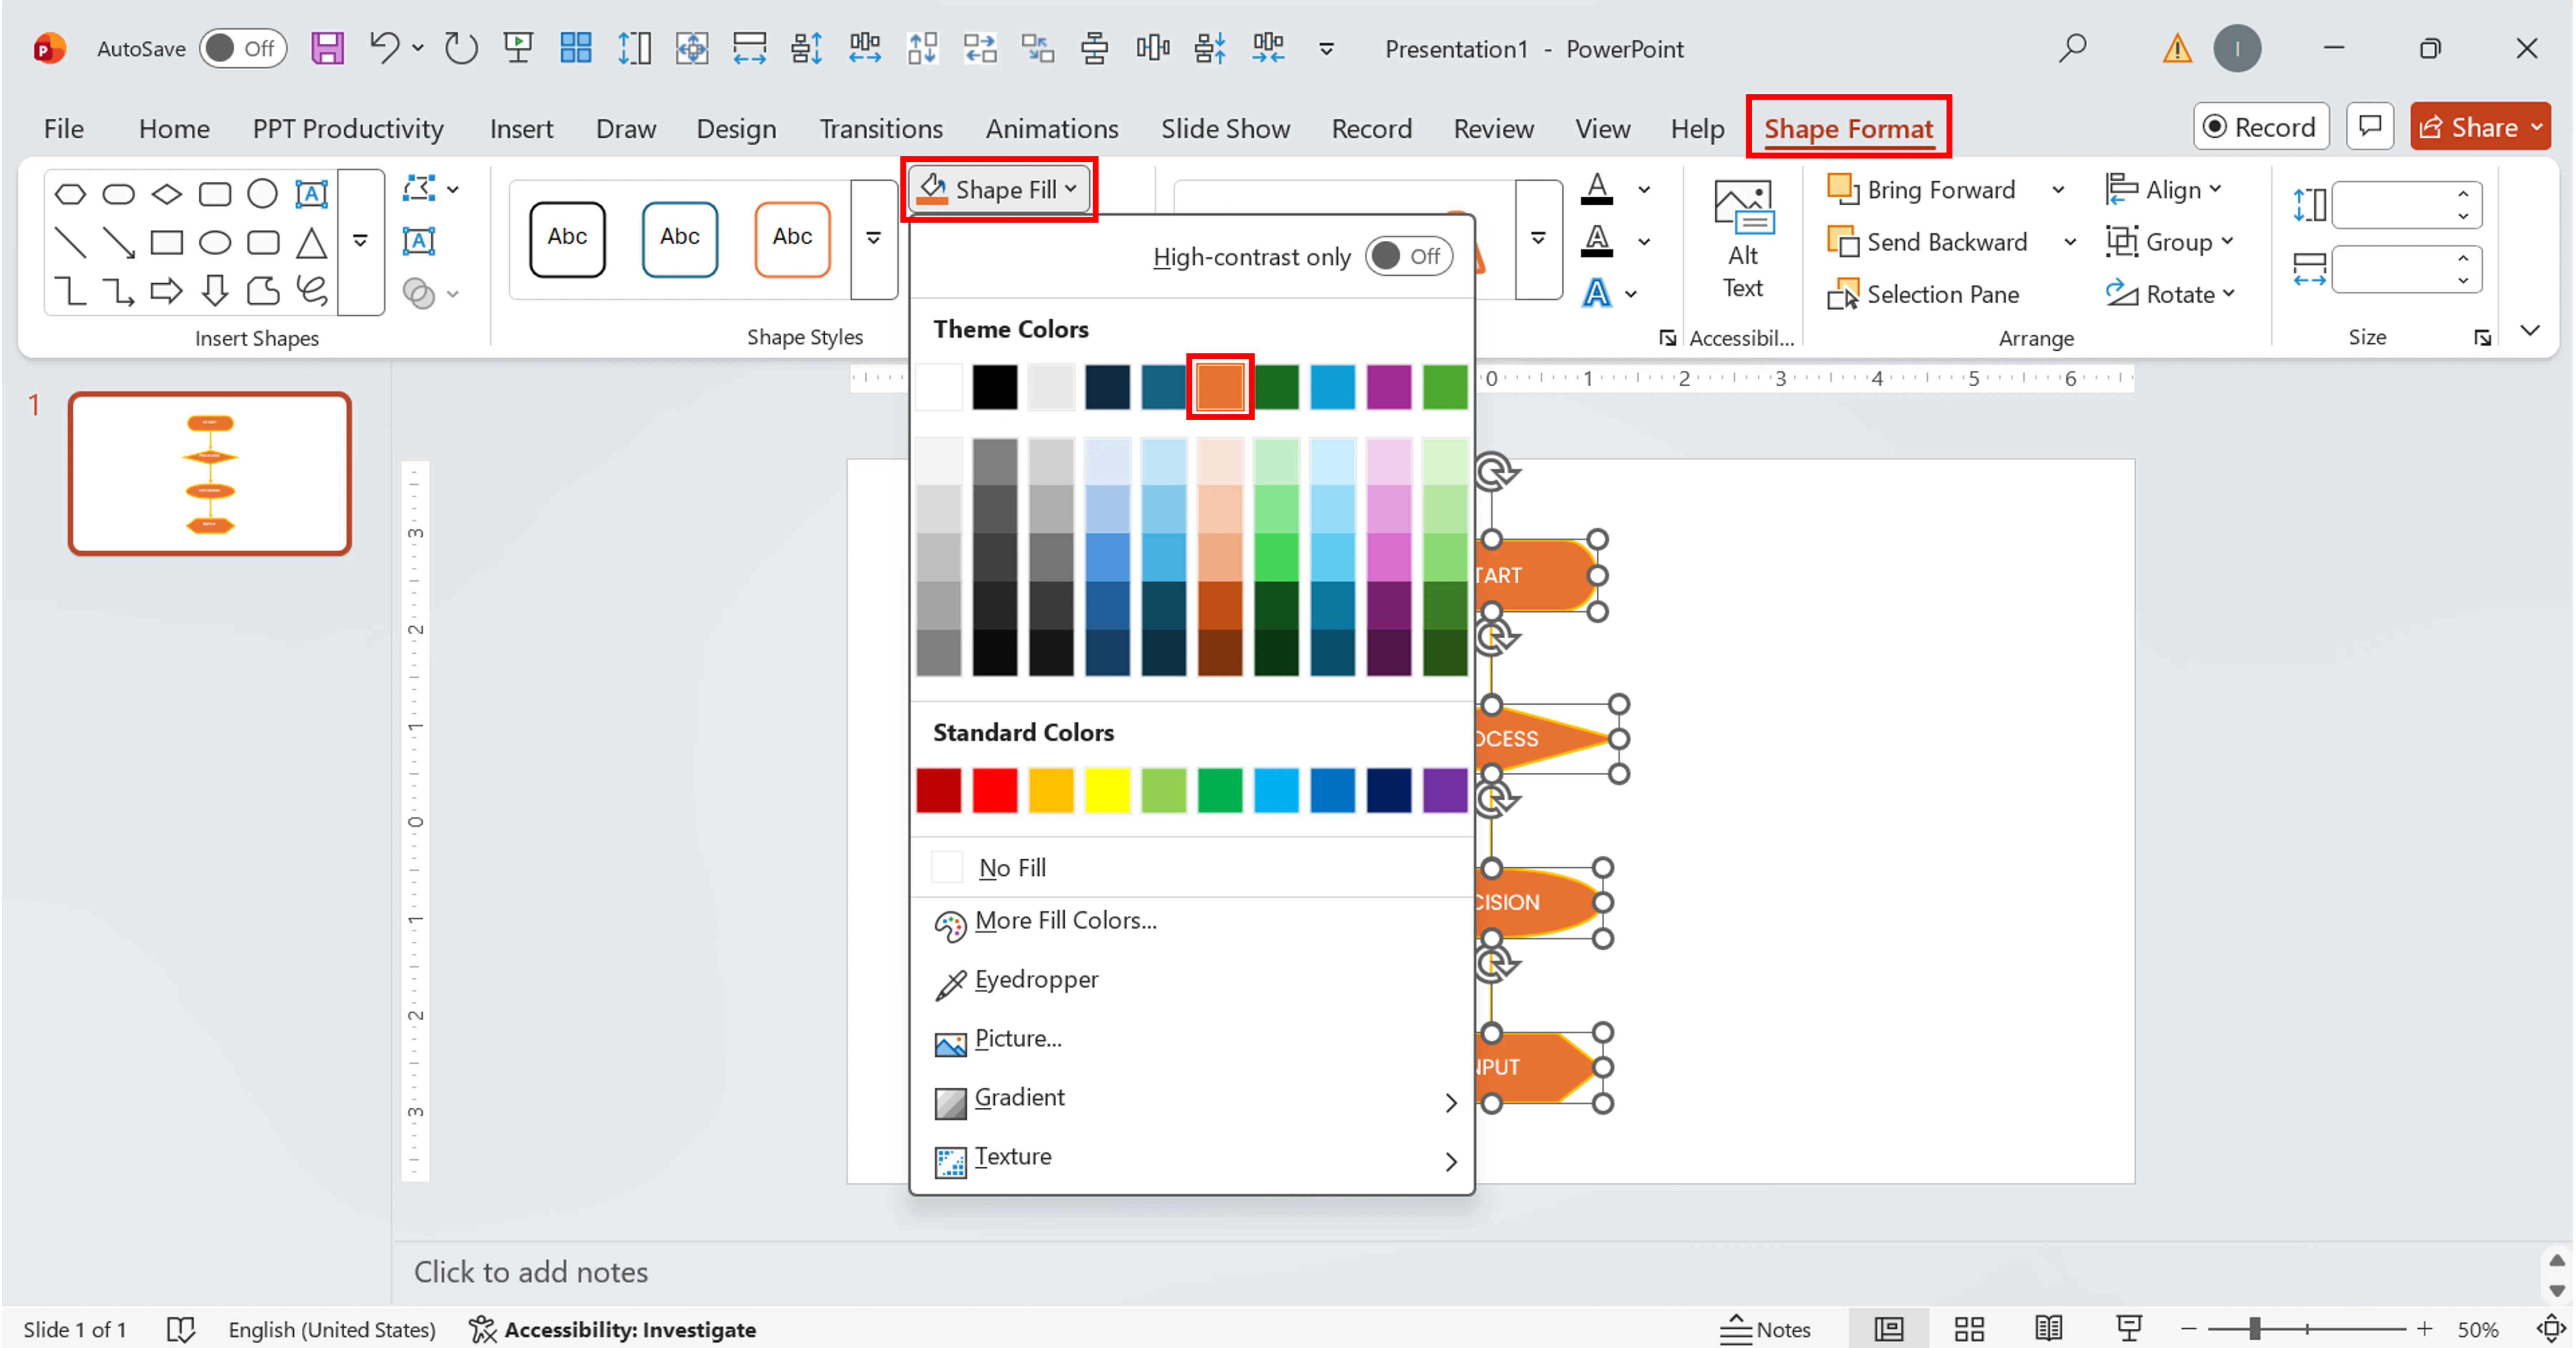
Apply a set of colours defined in your company's brand palette for all the elements except diamonds. They should be contrasting and stand out from the background.
Your diagram should now look polished and professional.
It's possible to build technically correct but still ineffective process diagrams in PowerPoint. There are several guidelines that you should follow in order to make a high-quality PowerPoint diagram tutorial.
Despite being easy, it's very easy to miss one or two things when building flowchart in PowerPoint. Here's a few mistakes that you should be aware of:
Sometimes, a process diagram needs to stand above all else because it's going to be included in a high-stakes presentation to investors or board members. In this case, it's better not to settle for a default template and make it really stand out. Let me introduce INK PPT, a presentation design agency that specialises in designing diagrams and motion graphics for businesses across Europe and worldwide.
As a passionate explorer, I see crafting the perfect story as embarking on a refreshing Himalayan journey. Every narrative is an adventure, a voyage of imagination, meticulously molded into captivating presentations. I'm here to guide you, ensuring your story becomes an unforgettable odyssey, with each creation as a vibrant landscape ready to captivate eager audiences.

About the Author


Consult with our Business Advisor